Capital One 2013 Annual Report Download - page 184
Download and view the complete annual report
Please find page 184 of the 2013 Capital One annual report below. You can navigate through the pages in the report by either clicking on the pages listed below, or by using the keyword search tool below to find specific information within the annual report.-
 1
1 -
2
-
3
-
4
-
5
-
6
-
7
-
8
-
9
-
10
-
11
-
12
-
13
-
14
-
15
-
16
-
17
-
18
-
19
-
20
-
21
-
22
-
23
-
24
-
25
-
26
-
27
-
28
-
29
-
30
-
31
-
32
-
33
-
34
-
35
-
36
-
37
-
38
-
39
-
40
-
41
-
42
-
43
-
44
-
45
-
46
-
47
-
48
-
49
-
50
-
51
-
52
-
53
-
54
-
55
-
56
-
57
-
58
-
59
-
60
-
61
-
62
-
63
-
64
-
65
-
66
-
67
-
68
-
69
-
70
-
71
-
72
-
73
-
74
-
75
-
76
-
77
-
78
-
79
-
80
-
81
-
82
-
83
-
84
-
85
-
86
-
87
-
88
-
89
-
90
-
91
-
92
-
93
-
94
-
95
-
96
-
97
-
98
-
99
-
100
-
101
-
102
-
103
-
104
-
105
-
106
-
107
-
108
-
109
-
110
-
111
-
112
-
113
-
114
-
115
-
116
-
117
-
118
-
119
-
120
-
121
-
122
-
123
-
124
-
125
-
126
-
127
-
128
-
129
-
130
-
131
-
132
-
133
-
134
-
135
-
136
-
137
-
138
-
139
-
140
-
141
-
142
-
143
-
144
-
145
-
146
-
147
-
148
-
149
-
150
-
151
-
152
-
153
-
154
-
155
-
156
-
157
-
158
-
159
-
160
-
161
-
162
-
163
-
164
-
165
-
166
-
167
-
168
-
169
-
170
-
171
-
172
-
173
-
 174
174 -
 175
175 -
 176
176 -
 177
177 -
 178
178 -
 179
179 -
 180
180 -
 181
181 -
 182
182 -
 183
183 -
 184
184 -
 185
185 -
 186
186 -
 187
187 -
 188
188 -
 189
189 -
 190
190 -
 191
191 -
 192
192 -
 193
193 -
 194
194 -
195
-
196
-
197
-
198
-
199
-
200
-
201
-
202
-
203
-
204
-
205
-
206
-
207
-
208
-
209
-
210
-
211
-
212
-
213
-
214
-
215
-
216
-
217
-
218
-
219
-
220
-
221
-
222
-
223
-
224
-
225
-
226
-
227
-
228
-
229
-
230
-
231
-
232
-
233
-
234
-
235
-
236
-
237
-
238
-
239
-
240
-
241
-
242
-
243
-
244
-
245
-
246
-
247
-
248
-
249
-
250
-
251
-
252
-
253
-
254
-
255
-
256
-
257
-
258
-
259
-
260
-
261
-
262
-
263
-
264
-
265
-
266
-
267
-
268
-
269
-
270
-
271
-
272
-
273
-
274
-
275
-
276
-
277
-
278
-
279
-
280
-
281
-
282
-
283
-
284
-
285
-
286
-
287
-
288
-
289
-
290
-
291
-
292
-
293
-
294
-
295
-
296
-
297
-
298
-
299
-
300
-
301
-
302
 |
 |

CAPITAL ONE FINANCIAL CORPORATION
NOTES TO CONSOLIDATED FINANCIAL STATEMENTS—(Continued)
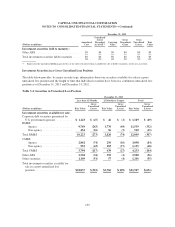
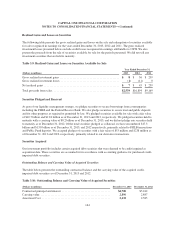
Realized Gains and Losses on Securities
The following table presents the gross realized gains and losses on the sale and redemption of securities available
for sale recognized in earnings for the years ended December 31, 2013, 2012 and 2011. The gross realized
investment losses presented below exclude credit losses recognized in earnings attributable to OTTI. We also
present the proceeds from the sale of securities available for sale for the periods presented. We did not sell any
investment securities that are held to maturity.
Table 3.9: Realized Gains and Losses on Securities Available for Sale
Year Ended December 31,
(Dollars in millions) 2013 2012 2011
Gross realized investment gains .......................................... $8$ 56 $ 259
Gross realized investment losses ......................................... (1) (11) 0
Net realized gains ..................................................... $7$ 45 $ 259
Total proceeds from sales ............................................... $2,539 $16,894 $9,169
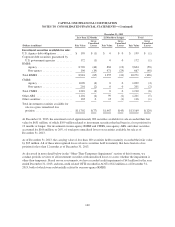
Securities Pledged and Received
As part of our liquidity management strategy, we pledge securities to secure borrowings from counterparties
including the FHLB and the Federal Reserve Bank. We also pledge securities to secure trust and public deposits
and for other purposes as required or permitted by law. We pledged securities available for sale with a fair value
of $10.7 billion and $13.8 billion as of December 31, 2013 and 2012, respectively. We pledged securities held to
maturity with a carrying value of $8.2 billion as of December 31, 2013, and we did not pledge any securities held
to maturity as of December 31, 2012. Of the total securities pledged as collateral, we have encumbered $17.3
billion and $13.8 billion as of December 31, 2013, and 2012 respectively, primarily related to FHLB transactions
and Public Fund deposits. We accepted pledges of securities with a fair value of $53 million and $238 million as
of December 31, 2013 and 2012, respectively, primarily related to our derivative transactions.
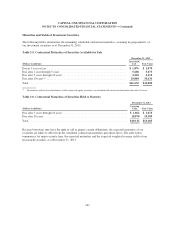
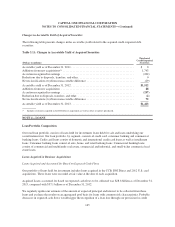
Securities Acquired
Our investment portfolio includes certain acquired debt securities that were deemed to be credit impaired at
acquisition date. These securities are accounted for in accordance with accounting guidance for purchased credit-
impaired debt securities.
Outstanding Balance and Carrying Value of Acquired Securities
The table below presents the outstanding contractual balance and the carrying value of the acquired credit-
impaired debt securities as of December 31, 2013 and 2012.
Table 3.10: Outstanding Balance and Carrying Value of Acquired Securities
(Dollars in millions) December 31, 2013 December 31, 2012
Contractual principal and interest .................................. $4,700 $5,242
Carrying value ................................................. 2,896 2,887
Amortized Cost ................................................ 2,432 2,585
164