Capital One 2013 Annual Report Download - page 59
Download and view the complete annual report
Please find page 59 of the 2013 Capital One annual report below. You can navigate through the pages in the report by either clicking on the pages listed below, or by using the keyword search tool below to find specific information within the annual report.-
 1
1 -
2
-
3
-
4
-
5
-
6
-
7
-
8
-
9
-
10
-
11
-
12
-
13
-
14
-
15
-
16
-
17
-
18
-
19
-
20
-
21
-
22
-
23
-
24
-
25
-
26
-
27
-
28
-
29
-
30
-
31
-
32
-
33
-
34
-
35
-
36
-
37
-
38
-
39
-
40
-
41
-
42
-
43
-
44
-
45
-
46
-
47
-
48
-
 49
49 -
 50
50 -
 51
51 -
 52
52 -
 53
53 -
 54
54 -
 55
55 -
 56
56 -
 57
57 -
 58
58 -
 59
59 -
 60
60 -
 61
61 -
 62
62 -
 63
63 -
 64
64 -
 65
65 -
 66
66 -
 67
67 -
 68
68 -
 69
69 -
70
-
71
-
72
-
73
-
74
-
75
-
76
-
77
-
78
-
79
-
80
-
81
-
82
-
83
-
84
-
85
-
86
-
87
-
88
-
89
-
90
-
91
-
92
-
93
-
94
-
95
-
96
-
97
-
98
-
99
-
100
-
101
-
102
-
103
-
104
-
105
-
106
-
107
-
108
-
109
-
110
-
111
-
112
-
113
-
114
-
115
-
116
-
117
-
118
-
119
-
120
-
121
-
122
-
123
-
124
-
125
-
126
-
127
-
128
-
129
-
130
-
131
-
132
-
133
-
134
-
135
-
136
-
137
-
138
-
139
-
140
-
141
-
142
-
143
-
144
-
145
-
146
-
147
-
148
-
149
-
150
-
151
-
152
-
153
-
154
-
155
-
156
-
157
-
158
-
159
-
160
-
161
-
162
-
163
-
164
-
165
-
166
-
167
-
168
-
169
-
170
-
171
-
172
-
173
-
174
-
175
-
176
-
177
-
178
-
179
-
180
-
181
-
182
-
183
-
184
-
185
-
186
-
187
-
188
-
189
-
190
-
191
-
192
-
193
-
194
-
195
-
196
-
197
-
198
-
199
-
200
-
201
-
202
-
203
-
204
-
205
-
206
-
207
-
208
-
209
-
210
-
211
-
212
-
213
-
214
-
215
-
216
-
217
-
218
-
219
-
220
-
221
-
222
-
223
-
224
-
225
-
226
-
227
-
228
-
229
-
230
-
231
-
232
-
233
-
234
-
235
-
236
-
237
-
238
-
239
-
240
-
241
-
242
-
243
-
244
-
245
-
246
-
247
-
248
-
249
-
250
-
251
-
252
-
253
-
254
-
255
-
256
-
257
-
258
-
259
-
260
-
261
-
262
-
263
-
264
-
265
-
266
-
267
-
268
-
269
-
270
-
271
-
272
-
273
-
274
-
275
-
276
-
277
-
278
-
279
-
280
-
281
-
282
-
283
-
284
-
285
-
286
-
287
-
288
-
289
-
290
-
291
-
292
-
293
-
294
-
295
-
296
-
297
-
298
-
299
-
300
-
301
-
302
 |
 |
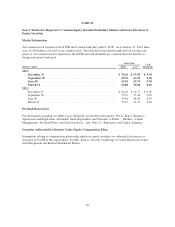
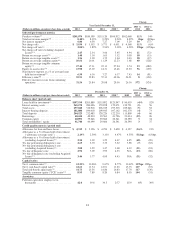
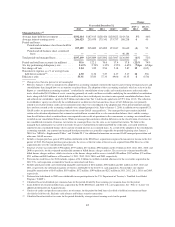
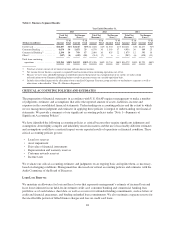
Item 6. Summary of Selected Financial Data
The following table presents selected consolidated financial data and performance metrics for the five-year
period ended December 31, 2013. Certain prior period amounts have been reclassified to conform to the current
period presentation. We prepare our consolidated financial statements based on U.S. GAAP, which we refer to as
our reported results. This data should be reviewed in conjunction with our audited consolidated financial
statements and related notes and with the MD&A included in this Report. The historical financial information
presented may not be indicative of our future performance. The comparability of our results of operations
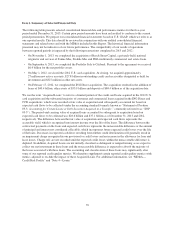
between reported periods is impacted by the following transactions completed in 2013 and 2012 :
• On November 1, 2013, we completed the acquisition of Beech Street Capital, a privately-held, national
originator and servicer of Fannie Mae, Freddie Mac and FHA multifamily commercial real estate loans.
• On September 6, 2013, we completed the Portfolio Sale to Citibank. Pursuant to the agreement we received
$6.4 billion for the net portfolio assets.
• On May 1, 2012, we closed the 2012 U.S. card acquisition. At closing, we acquired approximately
27 million new active accounts, $27.8 billion in outstanding credit card receivables designated as held for
investment and $327 million in other net assets.
• On February 17, 2012, we completed the ING Direct acquisition. The acquisition resulted in the addition of
loans of $40.4 billion, other assets of $53.9 billion and deposits of $84.4 billion as of the acquisition date.
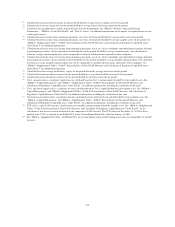
We use the term “Acquired Loans” to refer to a limited portion of the credit card loans acquired in the 2012 U.S.
card acquisition and the substantial majority of consumer and commercial loans acquired in the ING Direct and
CCB acquisitions, which were recorded at fair value at acquisition and subsequently accounted for based on
expected cash flows to be collected (under the accounting standard formerly known as “Statement of Position
03-3, Accounting for Certain Loans or Debt Securities Acquired in a Transfer,” commonly referred to as “SOP
03-3”). The period-end carrying value of acquired loans accounted for subsequent to acquisition based on
expected cash flows to be collected was $28.6 billion and $37.1 billion as of December 31, 2013 and 2012,
respectively. The difference between the fair value at acquisition and expected cash flows represents the
accretable yield, which is recognized into interest income over the life of the loans. The difference between the
contractual payments on the loans and expected cash flows represents the nonaccretable difference or the amount
of principal and interest not considered collectible, which incorporates future expected credit losses over the life
of the loans. Decreases in expected cash flows resulting from further credit deterioration will generally result in
an impairment charge recognized in our provision for credit losses and an increase in the allowance for loan and
lease losses. Charge offs are not recorded until the expected credit losses within the nonaccretable difference is
depleted. In addition, Acquired Loans are not initially classified as delinquent or nonperforming as we expect to
collect our net investment in these loans and the nonaccretable difference is expected to absorb the majority of
the losses associated with these loans. The accounting and classification of these loans may significantly alter
some of our reported credit quality metrics. We therefore supplement certain reported credit quality metrics with
metrics adjusted to exclude the impact of these Acquired Loans. For additional information, see “MD&A—
Credit Risk Profile” and “Note 4—Loans.”
39