Capital One 2013 Annual Report Download - page 118
Download and view the complete annual report
Please find page 118 of the 2013 Capital One annual report below. You can navigate through the pages in the report by either clicking on the pages listed below, or by using the keyword search tool below to find specific information within the annual report.-
 1
1 -
2
-
3
-
4
-
5
-
6
-
7
-
8
-
9
-
10
-
11
-
12
-
13
-
14
-
15
-
16
-
17
-
18
-
19
-
20
-
21
-
22
-
23
-
24
-
25
-
26
-
27
-
28
-
29
-
30
-
31
-
32
-
33
-
34
-
35
-
36
-
37
-
38
-
39
-
40
-
41
-
42
-
43
-
44
-
45
-
46
-
47
-
48
-
49
-
50
-
51
-
52
-
53
-
54
-
55
-
56
-
57
-
58
-
59
-
60
-
61
-
62
-
63
-
64
-
65
-
66
-
67
-
68
-
69
-
70
-
71
-
72
-
73
-
74
-
75
-
76
-
77
-
78
-
79
-
80
-
81
-
82
-
83
-
84
-
85
-
86
-
87
-
88
-
89
-
90
-
91
-
92
-
93
-
94
-
95
-
96
-
97
-
98
-
99
-
100
-
101
-
102
-
103
-
104
-
105
-
106
-
107
-
 108
108 -
 109
109 -
 110
110 -
 111
111 -
 112
112 -
 113
113 -
 114
114 -
 115
115 -
 116
116 -
 117
117 -
 118
118 -
 119
119 -
 120
120 -
 121
121 -
 122
122 -
 123
123 -
 124
124 -
 125
125 -
 126
126 -
 127
127 -
 128
128 -
129
-
130
-
131
-
132
-
133
-
134
-
135
-
136
-
137
-
138
-
139
-
140
-
141
-
142
-
143
-
144
-
145
-
146
-
147
-
148
-
149
-
150
-
151
-
152
-
153
-
154
-
155
-
156
-
157
-
158
-
159
-
160
-
161
-
162
-
163
-
164
-
165
-
166
-
167
-
168
-
169
-
170
-
171
-
172
-
173
-
174
-
175
-
176
-
177
-
178
-
179
-
180
-
181
-
182
-
183
-
184
-
185
-
186
-
187
-
188
-
189
-
190
-
191
-
192
-
193
-
194
-
195
-
196
-
197
-
198
-
199
-
200
-
201
-
202
-
203
-
204
-
205
-
206
-
207
-
208
-
209
-
210
-
211
-
212
-
213
-
214
-
215
-
216
-
217
-
218
-
219
-
220
-
221
-
222
-
223
-
224
-
225
-
226
-
227
-
228
-
229
-
230
-
231
-
232
-
233
-
234
-
235
-
236
-
237
-
238
-
239
-
240
-
241
-
242
-
243
-
244
-
245
-
246
-
247
-
248
-
249
-
250
-
251
-
252
-
253
-
254
-
255
-
256
-
257
-
258
-
259
-
260
-
261
-
262
-
263
-
264
-
265
-
266
-
267
-
268
-
269
-
270
-
271
-
272
-
273
-
274
-
275
-
276
-
277
-
278
-
279
-
280
-
281
-
282
-
283
-
284
-
285
-
286
-
287
-
288
-
289
-
290
-
291
-
292
-
293
-
294
-
295
-
296
-
297
-
298
-
299
-
300
-
301
-
302
 |
 |
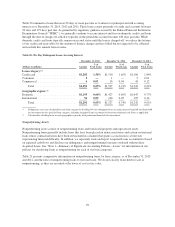
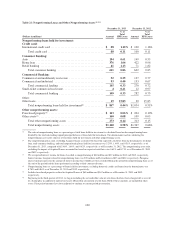
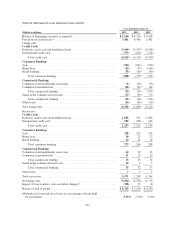
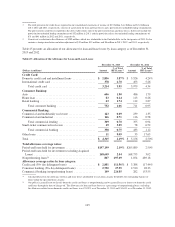
Table 18: 30+ Day Delinquencies
December 31, 2013 December 31, 2012
30+ Day Performing 30+ Day Total 30+ Day Performing 30+ Day Total
(Dollars in millions) Amount Rate(1)
Adjusted
Rate(2) Amount Rate(1)
Adjusted
Rate(2) Amount Rate(1)
Adjusted
Rate(2) Amount Rate(1)
Adjusted
Rate(2)
Credit Card:
Domestic credit card and
installment loans . ........... $2,514 3.43% 3.43% $2,514 3.43% 3.43%$3,001 3.61% 3.62% $3,001 3.61% 3.62%
International credit card . . . . . . . . . 299 3.71 3.71 367 4.56 4.56 308 3.58 3.58 387 4.49 4.49
Totalcreditcard ............... 2,813 3.46 3.46 2,881 3.54 3.55 3,309 3.61 3.62 3,388 3.69 3.70
Consumer Banking:
Auto........................ 2,181 6.85 6.85 2,375 7.46 7.46 1,900 7.00 7.01 2,049 7.55 7.56
Homeloan ................... 55 0.16 0.78 323 0.91 4.55 59 0.13 0.77 380 0.86 4.94
Retailbanking ................ 25 0.69 0.70 52 1.44 1.46 30 0.76 0.77 81 2.07 2.09
Total consumer banking . . . . . . . . . 2,261 3.20 5.32 2,750 3.89 6.47 1,989 2.65 5.14 2,510 3.34 6.49
Commercial Banking:
Commercial and multifamily real
estate ..................... 29 0.14 0.14 64 0.31 0.31 140 0.79 0.79 248 1.40 1.41
Commercial and industrial ....... 73 0.31 0.32 108 0.46 0.47 73 0.37 0.37 135 0.68 0.69
Total commercial lending . . . . . . . . 102 0.23 0.23 172 0.39 0.39 213 0.57 0.57 383 1.02 1.03
Small-ticket commercial real
estate ..................... 8 0.79 0.79 11 1.17 1.17 33 2.74 2.74 43 3.60 3.60
Total commercial banking . . . . . . . 110 0.24 0.25 183 0.41 0.41 246 0.63 0.64 426 1.10 1.11
Other:
Otherloans................... 4 3.32 3.32 19 15.72 15.72 11 5.72 6.95 36 19.25 23.38
Total ....................... $5,188 2.63% 3.08% $5,833 2.96% 3.46%$5,555 2.70% 3.29% $6,360 3.09% 3.77%
(1) Calculated by loan category by dividing 30+ day delinquent loans as of the end of the period by period-end loans held for investment
for the specified loan category, including Acquired Loans as applicable.
(2) Calculated by excluding Acquired Loans accounted for based on estimated cash flows from the denominator.
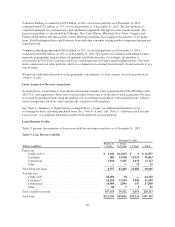
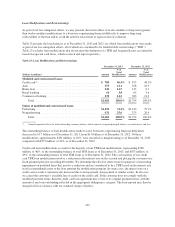
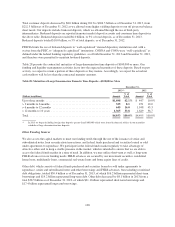
Table 19 presents an aging of 30+ day delinquent loans included in the above table.
Table 19: Aging and Geography of 30+ Day Delinquent Loans
December 31, 2013 December 31, 2012
(Dollars in millions) Amount
% of
Total Loans(1) Amount
% of
Total Loans(1)
Total loan portfolio ................................. $197,199 100% $205,889 100.0%
Delinquency status:
30 – 59 days ................................... $ 2,617 1.33% $ 2,664 1.29%
60 – 89 days ................................... 1,344 0.68 1,440 0.70
90 + days ..................................... 1,872 0.95 2,256 1.10
Total ............................................. $ 5,833 2.96% $ 6,360 3.09%
Geographic region:
Domestic ..................................... $ 5,466 2.77% $ 5,973 2.90%
International ................................... 367 0.19 387 0.19
Total ............................................. $ 5,833 2.96% $ 6,360 3.09%
(1) Calculated by dividing loans in each delinquency status category or geographic region as of the end of the period by the total held-for-
investment loan portfolio, including Acquired Loans accounted for based on estimated cash flows.
98