Capital One 2013 Annual Report Download - page 196
Download and view the complete annual report
Please find page 196 of the 2013 Capital One annual report below. You can navigate through the pages in the report by either clicking on the pages listed below, or by using the keyword search tool below to find specific information within the annual report.-
 1
1 -
2
-
3
-
4
-
5
-
6
-
7
-
8
-
9
-
10
-
11
-
12
-
13
-
14
-
15
-
16
-
17
-
18
-
19
-
20
-
21
-
22
-
23
-
24
-
25
-
26
-
27
-
28
-
29
-
30
-
31
-
32
-
33
-
34
-
35
-
36
-
37
-
38
-
39
-
40
-
41
-
42
-
43
-
44
-
45
-
46
-
47
-
48
-
49
-
50
-
51
-
52
-
53
-
54
-
55
-
56
-
57
-
58
-
59
-
60
-
61
-
62
-
63
-
64
-
65
-
66
-
67
-
68
-
69
-
70
-
71
-
72
-
73
-
74
-
75
-
76
-
77
-
78
-
79
-
80
-
81
-
82
-
83
-
84
-
85
-
86
-
87
-
88
-
89
-
90
-
91
-
92
-
93
-
94
-
95
-
96
-
97
-
98
-
99
-
100
-
101
-
102
-
103
-
104
-
105
-
106
-
107
-
108
-
109
-
110
-
111
-
112
-
113
-
114
-
115
-
116
-
117
-
118
-
119
-
120
-
121
-
122
-
123
-
124
-
125
-
126
-
127
-
128
-
129
-
130
-
131
-
132
-
133
-
134
-
135
-
136
-
137
-
138
-
139
-
140
-
141
-
142
-
143
-
144
-
145
-
146
-
147
-
148
-
149
-
150
-
151
-
152
-
153
-
154
-
155
-
156
-
157
-
158
-
159
-
160
-
161
-
162
-
163
-
164
-
165
-
166
-
167
-
168
-
169
-
170
-
171
-
172
-
173
-
174
-
175
-
176
-
177
-
178
-
179
-
180
-
181
-
182
-
183
-
184
-
185
-
 186
186 -
 187
187 -
 188
188 -
 189
189 -
 190
190 -
 191
191 -
 192
192 -
 193
193 -
 194
194 -
 195
195 -
 196
196 -
 197
197 -
 198
198 -
 199
199 -
 200
200 -
 201
201 -
 202
202 -
 203
203 -
 204
204 -
 205
205 -
 206
206 -
207
-
208
-
209
-
210
-
211
-
212
-
213
-
214
-
215
-
216
-
217
-
218
-
219
-
220
-
221
-
222
-
223
-
224
-
225
-
226
-
227
-
228
-
229
-
230
-
231
-
232
-
233
-
234
-
235
-
236
-
237
-
238
-
239
-
240
-
241
-
242
-
243
-
244
-
245
-
246
-
247
-
248
-
249
-
250
-
251
-
252
-
253
-
254
-
255
-
256
-
257
-
258
-
259
-
260
-
261
-
262
-
263
-
264
-
265
-
266
-
267
-
268
-
269
-
270
-
271
-
272
-
273
-
274
-
275
-
276
-
277
-
278
-
279
-
280
-
281
-
282
-
283
-
284
-
285
-
286
-
287
-
288
-
289
-
290
-
291
-
292
-
293
-
294
-
295
-
296
-
297
-
298
-
299
-
300
-
301
-
302
 |
 |

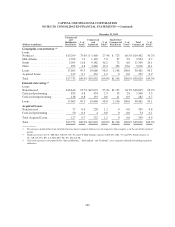
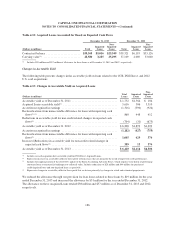
CAPITAL ONE FINANCIAL CORPORATION
NOTES TO CONSOLIDATED FINANCIAL STATEMENTS—(Continued)
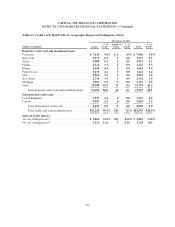
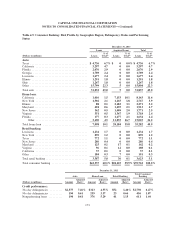
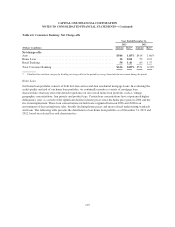
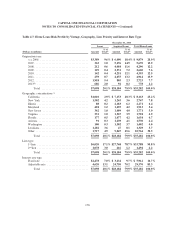
Table 4.7: Home Loan: Risk Profile by Vintage, Geography, Lien Priority and Interest Rate Type
December 31, 2013
Loans Acquired Loans Total Home Loans
(Dollars in millions) Amount
% of
Total(1) Amount
% of
Total(1) Amount
% of
Total(1)
Origination year:
< = 2006 .................................. $3,389 9.6% $ 6,490 18.4% $ 9,879 28.0%
2007 ...................................... 363 1.0 5,276 14.9 5,639 15.9
2008 ...................................... 212 0.6 4,084 11.6 4,296 12.2
2009 ...................................... 129 0.4 2,531 7.2 2,660 7.6
2010 ...................................... 142 0.4 4,251 12.1 4,393 12.5
2011 ...................................... 259 0.7 4,655 13.2 4,914 13.9
2012 ...................................... 1,918 5.4 805 2.3 2,723 7.7
2013(3) .................................... 686 2.0 92 0.2 778 2.2
Total ................................. $7,098 20.1% $28,184 79.9% $35,282 100.0%
Geographic concentration:(2)
California ................................. $1,010 2.9% $ 7,153 20.3% $ 8,163 23.2%
New York ................................. 1,502 4.2 1,265 3.6 2,767 7.8
Illinois .................................... 88 0.2 2,183 6.2 2,271 6.4
Maryland .................................. 418 1.2 1,495 4.2 1,913 5.4
New Jersey ................................ 362 1.0 1,409 4.0 1,771 5.0
Virginia ................................... 351 1.0 1,367 3.9 1,718 4.9
Florida .................................... 177 0.5 1,477 4.2 1,654 4.7
Arizona ................................... 91 0.3 1,439 4.1 1,530 4.4
Washington ................................ 100 0.3 1,302 3.7 1,402 4.0
Louisiana .................................. 1,282 3.6 47 0.1 1,329 3.7
Other ..................................... 1,717 4.9 9,047 25.6 10,764 30.5
Total ................................. $7,098 20.1% $28,184 79.9% $35,282 100.0%
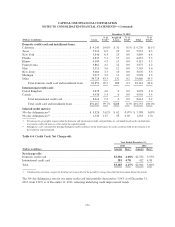
Lien type:
1st lien .................................... $6,020 17.1% $27,768 78.7% $33,788 95.8%
2nd lien .................................... 1,078 3.0 416 1.2 1,494 4.2
Total ................................. $7,098 20.1% $28,184 79.9% $35,282 100.0%
Interest rate type:
Fixed rate ................................. $2,478 7.0% $ 3,434 9.7% $ 5,912 16.7%
Adjustable rate ............................. 4,620 13.1 24,750 70.2 29,370 83.3
Total ................................. $7,098 20.1% $28,184 79.9% $35,282 100.0%
176