Capital One 2013 Annual Report Download - page 220
Download and view the complete annual report
Please find page 220 of the 2013 Capital One annual report below. You can navigate through the pages in the report by either clicking on the pages listed below, or by using the keyword search tool below to find specific information within the annual report.-
 1
1 -
2
-
3
-
4
-
5
-
6
-
7
-
8
-
9
-
10
-
11
-
12
-
13
-
14
-
15
-
16
-
17
-
18
-
19
-
20
-
21
-
22
-
23
-
24
-
25
-
26
-
27
-
28
-
29
-
30
-
31
-
32
-
33
-
34
-
35
-
36
-
37
-
38
-
39
-
40
-
41
-
42
-
43
-
44
-
45
-
46
-
47
-
48
-
49
-
50
-
51
-
52
-
53
-
54
-
55
-
56
-
57
-
58
-
59
-
60
-
61
-
62
-
63
-
64
-
65
-
66
-
67
-
68
-
69
-
70
-
71
-
72
-
73
-
74
-
75
-
76
-
77
-
78
-
79
-
80
-
81
-
82
-
83
-
84
-
85
-
86
-
87
-
88
-
89
-
90
-
91
-
92
-
93
-
94
-
95
-
96
-
97
-
98
-
99
-
100
-
101
-
102
-
103
-
104
-
105
-
106
-
107
-
108
-
109
-
110
-
111
-
112
-
113
-
114
-
115
-
116
-
117
-
118
-
119
-
120
-
121
-
122
-
123
-
124
-
125
-
126
-
127
-
128
-
129
-
130
-
131
-
132
-
133
-
134
-
135
-
136
-
137
-
138
-
139
-
140
-
141
-
142
-
143
-
144
-
145
-
146
-
147
-
148
-
149
-
150
-
151
-
152
-
153
-
154
-
155
-
156
-
157
-
158
-
159
-
160
-
161
-
162
-
163
-
164
-
165
-
166
-
167
-
168
-
169
-
170
-
171
-
172
-
173
-
174
-
175
-
176
-
177
-
178
-
179
-
180
-
181
-
182
-
183
-
184
-
185
-
186
-
187
-
188
-
189
-
190
-
191
-
192
-
193
-
194
-
195
-
196
-
197
-
198
-
199
-
200
-
201
-
202
-
203
-
204
-
205
-
206
-
207
-
208
-
209
-
 210
210 -
 211
211 -
 212
212 -
 213
213 -
 214
214 -
 215
215 -
 216
216 -
 217
217 -
 218
218 -
 219
219 -
 220
220 -
 221
221 -
 222
222 -
 223
223 -
 224
224 -
 225
225 -
 226
226 -
 227
227 -
 228
228 -
 229
229 -
 230
230 -
231
-
232
-
233
-
234
-
235
-
236
-
237
-
238
-
239
-
240
-
241
-
242
-
243
-
244
-
245
-
246
-
247
-
248
-
249
-
250
-
251
-
252
-
253
-
254
-
255
-
256
-
257
-
258
-
259
-
260
-
261
-
262
-
263
-
264
-
265
-
266
-
267
-
268
-
269
-
270
-
271
-
272
-
273
-
274
-
275
-
276
-
277
-
278
-
279
-
280
-
281
-
282
-
283
-
284
-
285
-
286
-
287
-
288
-
289
-
290
-
291
-
292
-
293
-
294
-
295
-
296
-
297
-
298
-
299
-
300
-
301
-
302
 |
 |

CAPITAL ONE FINANCIAL CORPORATION
NOTES TO CONSOLIDATED FINANCIAL STATEMENTS—(Continued)
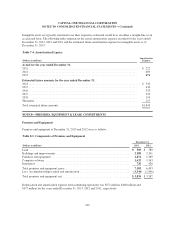
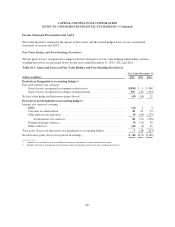
Lease Commitments
Certain premises and equipment are leased under agreements that expire at various dates through 2056, without
taking into consideration available renewal options. Many of these leases provide for payment by the lessee of
property taxes, insurance premiums, cost of maintenance and other costs. In some cases, rentals are subject to
increases in relation to a cost of living index. Total rent expenses from continuing operations amounted to
approximately $245 million, $216 million and $180 million for the years ended December 31, 2013, 2012 and
2011, respectively.
Future minimum rental commitments as of December 31, 2013, for all non-cancelable operating leases with
initial or remaining terms of one year or more are as follows:
Table 8.2: Lease Commitments
(Dollars in millions)
Estimated
Future
Minimum
Rental
Commitments
2014 ........................................................................... $ 245
2015 ........................................................................... 227
2016 ........................................................................... 213
2017 ........................................................................... 194
2018 ........................................................................... 171
Thereafter ....................................................................... 752
Total ........................................................................... $1,802
Minimum sublease rental income of $32 million due in future years under non-cancelable leases has not been
included in the table above as a reduction to minimum lease payments.
NOTE 9—DEPOSITS AND BORROWINGS
Customer Deposits
Our customer deposits, which are our largest source of funding for our operations and asset growth, consist of
non-interest bearing and interest-bearing deposits, including demand deposits, money market deposits, negotiable
order of withdrawal (“NOW”) accounts, savings accounts and certificates of deposit.
As of December 31, 2013, we had $181.9 billion in interest-bearing deposits, of which $4.0 billion represented
large denomination time deposits of $100,000 or more. As of December 31, 2012, we had $190.0 billion in
interest-bearing deposits, of which $4.5 billion represents large denomination time deposits of $100,000 or more.
Securitized Debt Obligations
Securitization debt obligations decreased by $1.1 billion during 2013 to $10.3 billion as of December 31, 2013,
from $11.4 billion as of December 31, 2012. The decrease was driven by maturities and repurchases totaling $3.3
billion, partially offset by the issuance of $2.2 billion of credit card securitization debt during 2013.
200