Capital One 2013 Annual Report Download - page 236
Download and view the complete annual report
Please find page 236 of the 2013 Capital One annual report below. You can navigate through the pages in the report by either clicking on the pages listed below, or by using the keyword search tool below to find specific information within the annual report.-
 1
1 -
2
-
3
-
4
-
5
-
6
-
7
-
8
-
9
-
10
-
11
-
12
-
13
-
14
-
15
-
16
-
17
-
18
-
19
-
20
-
21
-
22
-
23
-
24
-
25
-
26
-
27
-
28
-
29
-
30
-
31
-
32
-
33
-
34
-
35
-
36
-
37
-
38
-
39
-
40
-
41
-
42
-
43
-
44
-
45
-
46
-
47
-
48
-
49
-
50
-
51
-
52
-
53
-
54
-
55
-
56
-
57
-
58
-
59
-
60
-
61
-
62
-
63
-
64
-
65
-
66
-
67
-
68
-
69
-
70
-
71
-
72
-
73
-
74
-
75
-
76
-
77
-
78
-
79
-
80
-
81
-
82
-
83
-
84
-
85
-
86
-
87
-
88
-
89
-
90
-
91
-
92
-
93
-
94
-
95
-
96
-
97
-
98
-
99
-
100
-
101
-
102
-
103
-
104
-
105
-
106
-
107
-
108
-
109
-
110
-
111
-
112
-
113
-
114
-
115
-
116
-
117
-
118
-
119
-
120
-
121
-
122
-
123
-
124
-
125
-
126
-
127
-
128
-
129
-
130
-
131
-
132
-
133
-
134
-
135
-
136
-
137
-
138
-
139
-
140
-
141
-
142
-
143
-
144
-
145
-
146
-
147
-
148
-
149
-
150
-
151
-
152
-
153
-
154
-
155
-
156
-
157
-
158
-
159
-
160
-
161
-
162
-
163
-
164
-
165
-
166
-
167
-
168
-
169
-
170
-
171
-
172
-
173
-
174
-
175
-
176
-
177
-
178
-
179
-
180
-
181
-
182
-
183
-
184
-
185
-
186
-
187
-
188
-
189
-
190
-
191
-
192
-
193
-
194
-
195
-
196
-
197
-
198
-
199
-
200
-
201
-
202
-
203
-
204
-
205
-
206
-
207
-
208
-
209
-
210
-
211
-
212
-
213
-
214
-
215
-
216
-
217
-
218
-
219
-
220
-
221
-
222
-
223
-
224
-
225
-
 226
226 -
 227
227 -
 228
228 -
 229
229 -
 230
230 -
 231
231 -
 232
232 -
 233
233 -
 234
234 -
 235
235 -
 236
236 -
 237
237 -
 238
238 -
 239
239 -
 240
240 -
 241
241 -
 242
242 -
 243
243 -
 244
244 -
 245
245 -
 246
246 -
247
-
248
-
249
-
250
-
251
-
252
-
253
-
254
-
255
-
256
-
257
-
258
-
259
-
260
-
261
-
262
-
263
-
264
-
265
-
266
-
267
-
268
-
269
-
270
-
271
-
272
-
273
-
274
-
275
-
276
-
277
-
278
-
279
-
280
-
281
-
282
-
283
-
284
-
285
-
286
-
287
-
288
-
289
-
290
-
291
-
292
-
293
-
294
-
295
-
296
-
297
-
298
-
299
-
300
-
301
-
302
 |
 |

CAPITAL ONE FINANCIAL CORPORATION
NOTES TO CONSOLIDATED FINANCIAL STATEMENTS—(Continued)
anniversary of the grant date, however some option grants cliff vest on or shortly after the first or third
anniversary of the grant date and in no event will the exercise price of stock options be less than the fair market
value of our common stock on the date of grant. In addition, vesting is subject to the achievement of any
applicable performance conditions.
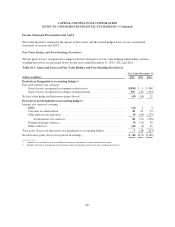
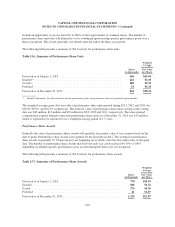
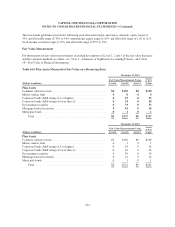
The following table presents a summary of 2013 activity for stock options and the balance of stock options
exercisable as of December 31, 2013.
Table 15.2: Summary of Stock Options Activity
Shares
Subject to
Options
(in thousands)
Weighted-
Average
Exercise
Price
Weighted-
Average
Remaining
Contractual
Term
Aggregate
Intrinsic
Value
(in millions)
Outstanding as of January 1, 2013 ..................... 14,259 $56.14
Granted .......................................... 680 56.32
Exercised ........................................ 2,305 45.68
Forfeited ......................................... 349 80.03
Expired .......................................... 34 65.07
Outstanding as of December 31, 2013 .................. 12,251 $57.41 4.3 years $258
Exercisable as of December 31, 2013 .................. 10,096 $58.98 3.6 years $200
The weighted-average fair value of each option granted for 2013, 2012 and 2011 was $13.42, $12.25 and $13.17,
respectively. The total intrinsic value of stock options exercised during 2013, 2012 and 2011 was $47 million,
$36 million, and $23 million, respectively. The unrecognized compensation expense related to the stock options
as of December 31, 2013 was $3 million, which is expected to be amortized over a weighted-average period of
0.7 years.
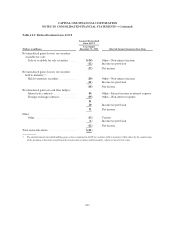
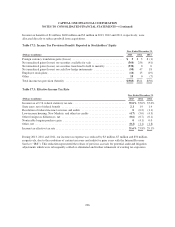
The following table sets forth the cash received from the exercise of stock options under all stock-based incentive
arrangements, and the actual income tax benefit realized related to tax deductions from the exercise of the stock
options.
Table 15.3: Stock Options Cash Flow Impact
Year ended December 31,
(In millions) 2013 2012 2011
Cash received for options exercised ..................................... $105 $66 $38
Tax benefit realized for options exercised ................................ 18 14 8
Compensation expense for stock options is based on the grant date fair value, which is estimated using the Black-
Scholes option-pricing model. The option pricing model requires the use of numerous assumptions, many of
which are subjective.
216