Capital One 2013 Annual Report Download - page 93
Download and view the complete annual report
Please find page 93 of the 2013 Capital One annual report below. You can navigate through the pages in the report by either clicking on the pages listed below, or by using the keyword search tool below to find specific information within the annual report.-
 1
1 -
2
-
3
-
4
-
5
-
6
-
7
-
8
-
9
-
10
-
11
-
12
-
13
-
14
-
15
-
16
-
17
-
18
-
19
-
20
-
21
-
22
-
23
-
24
-
25
-
26
-
27
-
28
-
29
-
30
-
31
-
32
-
33
-
34
-
35
-
36
-
37
-
38
-
39
-
40
-
41
-
42
-
43
-
44
-
45
-
46
-
47
-
48
-
49
-
50
-
51
-
52
-
53
-
54
-
55
-
56
-
57
-
58
-
59
-
60
-
61
-
62
-
63
-
64
-
65
-
66
-
67
-
68
-
69
-
70
-
71
-
72
-
73
-
74
-
75
-
76
-
77
-
78
-
79
-
80
-
81
-
82
-
 83
83 -
 84
84 -
 85
85 -
 86
86 -
 87
87 -
 88
88 -
 89
89 -
 90
90 -
 91
91 -
 92
92 -
 93
93 -
 94
94 -
 95
95 -
 96
96 -
 97
97 -
 98
98 -
 99
99 -
 100
100 -
 101
101 -
 102
102 -
 103
103 -
104
-
105
-
106
-
107
-
108
-
109
-
110
-
111
-
112
-
113
-
114
-
115
-
116
-
117
-
118
-
119
-
120
-
121
-
122
-
123
-
124
-
125
-
126
-
127
-
128
-
129
-
130
-
131
-
132
-
133
-
134
-
135
-
136
-
137
-
138
-
139
-
140
-
141
-
142
-
143
-
144
-
145
-
146
-
147
-
148
-
149
-
150
-
151
-
152
-
153
-
154
-
155
-
156
-
157
-
158
-
159
-
160
-
161
-
162
-
163
-
164
-
165
-
166
-
167
-
168
-
169
-
170
-
171
-
172
-
173
-
174
-
175
-
176
-
177
-
178
-
179
-
180
-
181
-
182
-
183
-
184
-
185
-
186
-
187
-
188
-
189
-
190
-
191
-
192
-
193
-
194
-
195
-
196
-
197
-
198
-
199
-
200
-
201
-
202
-
203
-
204
-
205
-
206
-
207
-
208
-
209
-
210
-
211
-
212
-
213
-
214
-
215
-
216
-
217
-
218
-
219
-
220
-
221
-
222
-
223
-
224
-
225
-
226
-
227
-
228
-
229
-
230
-
231
-
232
-
233
-
234
-
235
-
236
-
237
-
238
-
239
-
240
-
241
-
242
-
243
-
244
-
245
-
246
-
247
-
248
-
249
-
250
-
251
-
252
-
253
-
254
-
255
-
256
-
257
-
258
-
259
-
260
-
261
-
262
-
263
-
264
-
265
-
266
-
267
-
268
-
269
-
270
-
271
-
272
-
273
-
274
-
275
-
276
-
277
-
278
-
279
-
280
-
281
-
282
-
283
-
284
-
285
-
286
-
287
-
288
-
289
-
290
-
291
-
292
-
293
-
294
-
295
-
296
-
297
-
298
-
299
-
300
-
301
-
302
 |
 |

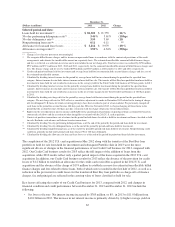
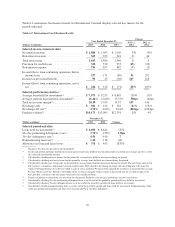
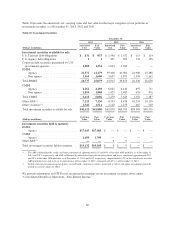
** Change is less than one percent or not meaningful.
(1) Loans held for investment includes loans acquired in the ING Direct and CCB acquisitions. The carrying value of
consumer banking Acquired Loans was $28.2 billion and $36.5 billion as of December 31, 2013 and 2012, respectively.
The average balance of consumer banking loans held for investment, excluding Acquired Loans, was $40.8 billion, $36.7
billion and $30.3 billion in 2013, 2012 and 2011, respectively.
(2) Calculated by dividing interest income for the period by average loans held for investment during the period.
(3) Calculated by dividing net charge-offs for the period by average loans held for investment during the period.
(4) Calculation of ratio adjusted to exclude Acquired Loans from the denominator. See “Credit Risk Profile” and “Note 4—
Loans” for additional information on the impact of Acquired Loans on our credit quality metrics.
(5) Calculated by dividing 30+ day performing delinquent loans as of the end of the period by period-end loans held for
investment.
(6) Calculated by dividing 30+ day delinquent loans as of the end of the period by period-end loans held for investment.
(7) Calculated by dividing nonperforming loans as of the end of the period by period-end loans held for investment.
Nonperforming loans generally include loans that have been placed on nonaccrual status and certain restructured loans
whose contractual terms have been restructured in a manner that grants a concession to a borrower experiencing financial
difficulty.
(8) Calculated by dividing nonperforming assets as of the end of the period by the sum of period-end loans held for
investment, foreclosed properties, and other foreclosed assets.
(9) Calculated by dividing the allowance for loan and lease losses as of the end of the period by period-end loans held for
investment.
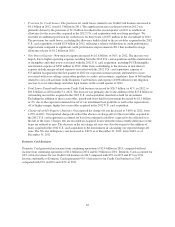
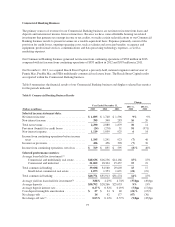
Key factors affecting the results of our Consumer Banking business for 2013, compared with 2012, and changes
in financial condition and credit performance between December 31, 2013 and December 31, 2012 include the
following:
•Net Interest Income: Net interest income increased by $117 million, or 2%, in 2013 to $5.9 billion from
$5.8 billion in 2012. The increase in net interest income is primarily attributable to growth in our auto loans,
partially offset by lower auto and deposits margins. While average loan balances have grown in 2013 as
compared to 2012, we have continued to see a decline in gross interest income due to overall lower average
yields on loans. The decrease in auto yields is primarily attributable to a shift in the credit quality mix of our
portfolio, as well as increased competition in the marketplace. The average yield on auto loans for 2013 was
9.8%, as compared to 11.0% in 2012. The decrease in home loans was largely driven by the continued
expected run-off of the acquired home loans portfolio. The average yield on home loans was 3.4% in 2013
compared to 3.6% in 2012. Average deposit balances increased to $169.7 billion in 2013 from $162.6
billion in 2012, while the average deposit interest rate declined to 0.63% in 2013 from 0.70% in 2012. We
expect the yields in our Consumer Banking business to continue to decline as we face increased competition
in auto loans, the continued shift to higher credit quality in our auto loan portfolio, and continued deposit
rate compression.
•Non-Interest Income: Non-interest income decreased by $33 million, or 4%, to $749 million in 2013 from
$782 million in 2012 related to the mark-to-market gains on retained interests in interest-only strips and
negative amortization mortgage securities recognized in the third quarter of 2012.
•Provision for Credit Losses: The provision for credit losses increased by $67 million or 11% in 2013 to
$656 million, reflecting higher auto loan charge-offs attributable to auto portfolio growth and an increase in
the auto charge-off rate from historically low levels. As discussed above under “Summary of Selected
Financial Data,” the substantial majority of the ING Direct home loan portfolio is accounted for based on
estimated cash flows expected to be collected over the life of the loans. Because accounting based on
estimated cash flows takes into consideration future credit losses expected to be incurred, charge-offs are
not recorded until the expected credit losses within the nonaccretable difference is depleted.
•Non-Interest Expense: Non-interest expense decreased by $126 million, or 3%, in 2013 to $3.7 billion. The
decrease was largely due to the absence of ING Direct acquisition-related costs and other one-time items
incurred in 2012, which were partially offset by increased expenses related to the growth in our auto loan
portfolio.
73