Capital One 2013 Annual Report Download - page 20
Download and view the complete annual report
Please find page 20 of the 2013 Capital One annual report below. You can navigate through the pages in the report by either clicking on the pages listed below, or by using the keyword search tool below to find specific information within the annual report.-
 1
1 -
2
-
3
-
4
-
5
-
6
-
7
-
8
-
9
-
 10
10 -
 11
11 -
 12
12 -
 13
13 -
 14
14 -
 15
15 -
 16
16 -
 17
17 -
 18
18 -
 19
19 -
 20
20 -
 21
21 -
 22
22 -
 23
23 -
 24
24 -
 25
25 -
 26
26 -
 27
27 -
 28
28 -
 29
29 -
 30
30 -
31
-
32
-
33
-
34
-
35
-
36
-
37
-
38
-
39
-
40
-
41
-
42
-
43
-
44
-
45
-
46
-
47
-
48
-
49
-
50
-
51
-
52
-
53
-
54
-
55
-
56
-
57
-
58
-
59
-
60
-
61
-
62
-
63
-
64
-
65
-
66
-
67
-
68
-
69
-
70
-
71
-
72
-
73
-
74
-
75
-
76
-
77
-
78
-
79
-
80
-
81
-
82
-
83
-
84
-
85
-
86
-
87
-
88
-
89
-
90
-
91
-
92
-
93
-
94
-
95
-
96
-
97
-
98
-
99
-
100
-
101
-
102
-
103
-
104
-
105
-
106
-
107
-
108
-
109
-
110
-
111
-
112
-
113
-
114
-
115
-
116
-
117
-
118
-
119
-
120
-
121
-
122
-
123
-
124
-
125
-
126
-
127
-
128
-
129
-
130
-
131
-
132
-
133
-
134
-
135
-
136
-
137
-
138
-
139
-
140
-
141
-
142
-
143
-
144
-
145
-
146
-
147
-
148
-
149
-
150
-
151
-
152
-
153
-
154
-
155
-
156
-
157
-
158
-
159
-
160
-
161
-
162
-
163
-
164
-
165
-
166
-
167
-
168
-
169
-
170
-
171
-
172
-
173
-
174
-
175
-
176
-
177
-
178
-
179
-
180
-
181
-
182
-
183
-
184
-
185
-
186
-
187
-
188
-
189
-
190
-
191
-
192
-
193
-
194
-
195
-
196
-
197
-
198
-
199
-
200
-
201
-
202
-
203
-
204
-
205
-
206
-
207
-
208
-
209
-
210
-
211
-
212
-
213
-
214
-
215
-
216
-
217
-
218
-
219
-
220
-
221
-
222
-
223
-
224
-
225
-
226
-
227
-
228
-
229
-
230
-
231
-
232
-
233
-
234
-
235
-
236
-
237
-
238
-
239
-
240
-
241
-
242
-
243
-
244
-
245
-
246
-
247
-
248
-
249
-
250
-
251
-
252
-
253
-
254
-
255
-
256
-
257
-
258
-
259
-
260
-
261
-
262
-
263
-
264
-
265
-
266
-
267
-
268
-
269
-
270
-
271
-
272
-
273
-
274
-
275
-
276
-
277
-
278
-
279
-
280
-
281
-
282
-
283
-
284
-
285
-
286
-
287
-
288
-
289
-
290
-
291
-
292
-
293
-
294
-
295
-
296
-
297
-
298
-
299
-
300
-
301
-
302
 |
 |

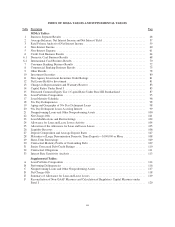
INDEX OF MD&A TABLES AND SUPPLEMENTAL TABLES
Table Description Page
MD&A Tables:
1 Business Segment Results .......................................................... 48
2 Average Balances, Net Interest Income and Net Interest Yield .............................. 57
3 Rate/Volume Analysis of Net Interest Income ........................................... 59
4 Non-Interest Income ............................................................... 60
5 Non-Interest Expense .............................................................. 61
6 Credit Card Business Results ........................................................ 64
6.1 Domestic Card Business Results ..................................................... 68
6.2 International Card Business Results ................................................... 70
7 Consumer Banking Business Results .................................................. 72
8 Commercial Banking Business Results ................................................ 75
9 Other Results ..................................................................... 78
10 Investment Securities .............................................................. 80
11 Non-Agency Investment Securities Credit Ratings ....................................... 81
12 Net Loans Held for Investment ....................................................... 81
13 Changes in Representation and Warranty Reserve ........................................ 83
14 Capital Ratios Under Basel I ........................................................ 85
15 Estimated Common Equity Tier 1 Capital Ratio Under Basel III Standardized ................. 87
16 Loan Portfolio Composition ......................................................... 95
17 Loan Maturity Schedule ............................................................ 96
18 30+ Day Delinquencies ............................................................. 98
19 Aging and Geography of 30+ Day Delinquent Loans ..................................... 98
20 90+ Day Delinquent Loans Accruing Interest ........................................... 99
21 Nonperforming Loans and Other Nonperforming Assets ................................... 100
22 Net Charge-Offs .................................................................. 101
23 Loan Modifications and Restructurings ................................................ 102
24 Allowance for Loan and Lease Losses Activity .......................................... 104
25 Allocation of the Allowance for Loan and Lease Losses ................................... 105
26 Liquidity Reserves ................................................................ 106
27 Deposit Composition and Average Deposit Rates ........................................ 107
28 Maturities of Large Denomination Domestic Time Deposits—$100,000 or More ............... 108
29 Short-Term Borrowings ............................................................ 109
30 Contractual Maturity Profile of Outstanding Debt ........................................ 109
31 Senior Unsecured Debt Credit Ratings ................................................. 110
32 Contractual Obligations ............................................................ 111
33 Interest Rate Sensitivity Analysis ..................................................... 113
Supplemental Tables:
A Loan Portfolio Composition ......................................................... 114
B Performing Delinquencies .......................................................... 116
C Nonperforming Loans and Other Nonperforming Assets ................................... 117
D Net Charge-Offs .................................................................. 118
E Summary of Allowance for Loan and Lease Losses ...................................... 119
F Reconciliation of Non-GAAP Measures and Calculation of Regulatory Capital Measures under
Basel I .......................................................................... 120
iii