Capital One 2013 Annual Report Download - page 193
Download and view the complete annual report
Please find page 193 of the 2013 Capital One annual report below. You can navigate through the pages in the report by either clicking on the pages listed below, or by using the keyword search tool below to find specific information within the annual report.-
 1
1 -
2
-
3
-
4
-
5
-
6
-
7
-
8
-
9
-
10
-
11
-
12
-
13
-
14
-
15
-
16
-
17
-
18
-
19
-
20
-
21
-
22
-
23
-
24
-
25
-
26
-
27
-
28
-
29
-
30
-
31
-
32
-
33
-
34
-
35
-
36
-
37
-
38
-
39
-
40
-
41
-
42
-
43
-
44
-
45
-
46
-
47
-
48
-
49
-
50
-
51
-
52
-
53
-
54
-
55
-
56
-
57
-
58
-
59
-
60
-
61
-
62
-
63
-
64
-
65
-
66
-
67
-
68
-
69
-
70
-
71
-
72
-
73
-
74
-
75
-
76
-
77
-
78
-
79
-
80
-
81
-
82
-
83
-
84
-
85
-
86
-
87
-
88
-
89
-
90
-
91
-
92
-
93
-
94
-
95
-
96
-
97
-
98
-
99
-
100
-
101
-
102
-
103
-
104
-
105
-
106
-
107
-
108
-
109
-
110
-
111
-
112
-
113
-
114
-
115
-
116
-
117
-
118
-
119
-
120
-
121
-
122
-
123
-
124
-
125
-
126
-
127
-
128
-
129
-
130
-
131
-
132
-
133
-
134
-
135
-
136
-
137
-
138
-
139
-
140
-
141
-
142
-
143
-
144
-
145
-
146
-
147
-
148
-
149
-
150
-
151
-
152
-
153
-
154
-
155
-
156
-
157
-
158
-
159
-
160
-
161
-
162
-
163
-
164
-
165
-
166
-
167
-
168
-
169
-
170
-
171
-
172
-
173
-
174
-
175
-
176
-
177
-
178
-
179
-
180
-
181
-
182
-
 183
183 -
 184
184 -
 185
185 -
 186
186 -
 187
187 -
 188
188 -
 189
189 -
 190
190 -
 191
191 -
 192
192 -
 193
193 -
 194
194 -
 195
195 -
 196
196 -
 197
197 -
 198
198 -
 199
199 -
 200
200 -
 201
201 -
 202
202 -
 203
203 -
204
-
205
-
206
-
207
-
208
-
209
-
210
-
211
-
212
-
213
-
214
-
215
-
216
-
217
-
218
-
219
-
220
-
221
-
222
-
223
-
224
-
225
-
226
-
227
-
228
-
229
-
230
-
231
-
232
-
233
-
234
-
235
-
236
-
237
-
238
-
239
-
240
-
241
-
242
-
243
-
244
-
245
-
246
-
247
-
248
-
249
-
250
-
251
-
252
-
253
-
254
-
255
-
256
-
257
-
258
-
259
-
260
-
261
-
262
-
263
-
264
-
265
-
266
-
267
-
268
-
269
-
270
-
271
-
272
-
273
-
274
-
275
-
276
-
277
-
278
-
279
-
280
-
281
-
282
-
283
-
284
-
285
-
286
-
287
-
288
-
289
-
290
-
291
-
292
-
293
-
294
-
295
-
296
-
297
-
298
-
299
-
300
-
301
-
302
 |
 |

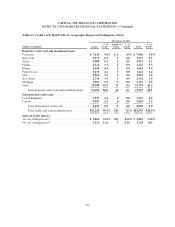
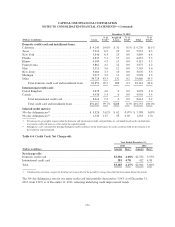
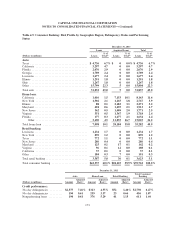
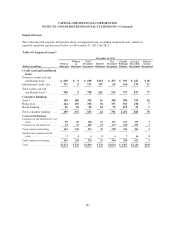
CAPITAL ONE FINANCIAL CORPORATION
NOTES TO CONSOLIDATED FINANCIAL STATEMENTS—(Continued)
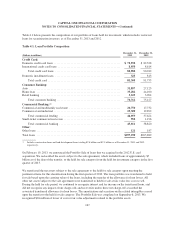
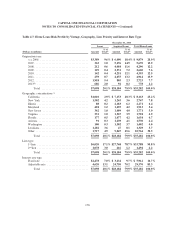
Table 4.5: Consumer Banking: Risk Profile by Geographic Region, Delinquency Status and Performing
Status
December 31, 2013
Loans Acquired Loans Total
(Dollars in millions) Loans
% of
Total(1) Loans
% of
Total(1) Loans
% of
Total(1)
Auto:
Texas ........................................ $ 4,736 6.7% $ 0 0.0% $ 4,736 6.7%
California .................................... 3,297 4.7 0 0.0 3,297 4.7
Florida ....................................... 2,076 2.9 0 0.0 2,076 2.9
Georgia ...................................... 1,709 2.4 0 0.0 1,709 2.4
Louisiana ..................................... 1,677 2.4 0 0.0 1,677 2.4
Illinois ....................................... 1,291 1.8 0 0.0 1,291 1.8
Ohio ......................................... 1,267 1.8 0 0.0 1,267 1.8
Other ........................................ 15,799 22.3 5 0.0 15,804 22.3
Total auto .................................... 31,852 45.0 5 0.0 31,857 45.0
Home loan:
California .................................... 1,010 1.5 7,153 10.1 8,163 11.6
New York .................................... 1,502 2.1 1,265 1.8 2,767 3.9
Illinois ....................................... 88 0.1 2,183 3.1 2,271 3.2
Maryland ..................................... 418 0.6 1,495 2.1 1,913 2.7
New Jersey ................................... 362 0.5 1,409 2.0 1,771 2.5
Virginia ...................................... 351 0.5 1,367 1.9 1,718 2.4
Florida ....................................... 177 0.3 1,477 2.1 1,654 2.4
Other .................................... 3,190 4.5 11,835 16.7 15,025 21.2
Total home loan ............................... 7,098 10.1 28,184 39.8 35,282 49.9
Retail banking:
Louisiana ..................................... 1,234 1.7 0 0.0 1,234 1.7
New York .................................... 859 1.2 0 0.0 859 1.2
Texas ........................................ 772 1.1 0 0.0 772 1.1
New Jersey ................................... 280 0.4 0 0.0 280 0.4
Maryland ..................................... 125 0.1 17 0.1 142 0.2
Virginia ...................................... 96 0.1 12 0.0 108 0.1
California .................................... 37 0.1 0 0.0 37 0.1
Other ........................................ 184 0.3 7 0.0 191 0.3
Total retail banking ............................. 3,587 5.0 36 0.1 3,623 5.1
Total consumer banking ......................... $42,537 60.1% $28,225 39.9% $70,762 100.0%
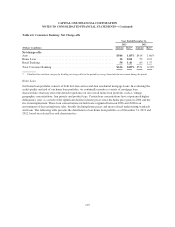
December 31, 2013
Auto Home Loan Retail Banking
Total Consumer
Banking
(Dollars in millions) Amount
Adjusted
Rate(2) Amount
Adjusted
Rate(2) Amount
Adjusted
Rate(2) Amount
Adjusted
Rate(2)
Credit performance:
30+ day delinquencies ......... $2,375 7.46% $323 4.55% $52 1.46% $2,750 6.47%
90+ day delinquencies ......... 194 0.61 239 3.37 23 0.66 456 1.07
Nonperforming loans .......... 194 0.61 376 5.29 41 1.15 611 1.44
173