Capital One 2013 Annual Report Download - page 68
Download and view the complete annual report
Please find page 68 of the 2013 Capital One annual report below. You can navigate through the pages in the report by either clicking on the pages listed below, or by using the keyword search tool below to find specific information within the annual report.-
 1
1 -
2
-
3
-
4
-
5
-
6
-
7
-
8
-
9
-
10
-
11
-
12
-
13
-
14
-
15
-
16
-
17
-
18
-
19
-
20
-
21
-
22
-
23
-
24
-
25
-
26
-
27
-
28
-
29
-
30
-
31
-
32
-
33
-
34
-
35
-
36
-
37
-
38
-
39
-
40
-
41
-
42
-
43
-
44
-
45
-
46
-
47
-
48
-
49
-
50
-
51
-
52
-
53
-
54
-
55
-
56
-
57
-
 58
58 -
 59
59 -
 60
60 -
 61
61 -
 62
62 -
 63
63 -
 64
64 -
 65
65 -
 66
66 -
 67
67 -
 68
68 -
 69
69 -
 70
70 -
 71
71 -
 72
72 -
 73
73 -
 74
74 -
 75
75 -
 76
76 -
 77
77 -
 78
78 -
79
-
80
-
81
-
82
-
83
-
84
-
85
-
86
-
87
-
88
-
89
-
90
-
91
-
92
-
93
-
94
-
95
-
96
-
97
-
98
-
99
-
100
-
101
-
102
-
103
-
104
-
105
-
106
-
107
-
108
-
109
-
110
-
111
-
112
-
113
-
114
-
115
-
116
-
117
-
118
-
119
-
120
-
121
-
122
-
123
-
124
-
125
-
126
-
127
-
128
-
129
-
130
-
131
-
132
-
133
-
134
-
135
-
136
-
137
-
138
-
139
-
140
-
141
-
142
-
143
-
144
-
145
-
146
-
147
-
148
-
149
-
150
-
151
-
152
-
153
-
154
-
155
-
156
-
157
-
158
-
159
-
160
-
161
-
162
-
163
-
164
-
165
-
166
-
167
-
168
-
169
-
170
-
171
-
172
-
173
-
174
-
175
-
176
-
177
-
178
-
179
-
180
-
181
-
182
-
183
-
184
-
185
-
186
-
187
-
188
-
189
-
190
-
191
-
192
-
193
-
194
-
195
-
196
-
197
-
198
-
199
-
200
-
201
-
202
-
203
-
204
-
205
-
206
-
207
-
208
-
209
-
210
-
211
-
212
-
213
-
214
-
215
-
216
-
217
-
218
-
219
-
220
-
221
-
222
-
223
-
224
-
225
-
226
-
227
-
228
-
229
-
230
-
231
-
232
-
233
-
234
-
235
-
236
-
237
-
238
-
239
-
240
-
241
-
242
-
243
-
244
-
245
-
246
-
247
-
248
-
249
-
250
-
251
-
252
-
253
-
254
-
255
-
256
-
257
-
258
-
259
-
260
-
261
-
262
-
263
-
264
-
265
-
266
-
267
-
268
-
269
-
270
-
271
-
272
-
273
-
274
-
275
-
276
-
277
-
278
-
279
-
280
-
281
-
282
-
283
-
284
-
285
-
286
-
287
-
288
-
289
-
290
-
291
-
292
-
293
-
294
-
295
-
296
-
297
-
298
-
299
-
300
-
301
-
302
 |
 |

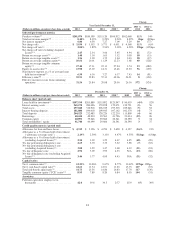
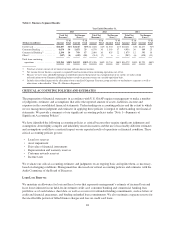
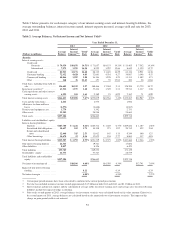
Table 1: Business Segment Results
Year Ended December 31,
2013 2012 2011
Total Net
Revenue(1)
Net Income
(Loss)(2)
Total Net
Revenue(1)
Net Income
(Loss)(2)
Total Net
Revenue(1)
Net Income
(Loss)(2)
(Dollars in millions) Amount
% of
Total Amount
% of
Total Amount
% of
Total Amount
% of
Total Amount
% of
Total Amount
% of
Total
Credit Card .................. $14,287 64% $2,615 60% $13,260 62% $1,530 41% $10,431 64% $2,277 70%
Consumer Banking ............ 6,654 30 1,451 33 6,570 30 1,363 37 4,956 30 809 25
Commercial Banking(3) ......... 2,290 10 769 17 2,080 10 835 22 1,879 12 595 18
Other(4) ..................... (847) (4) (443) (10) (514) (2) 6 — (987) (6) (428) (13)
Total from continuing
operations ................. $22,384 100% $4,392 100% $21,396 100% $3,734 100% $16,279 100% $3,253 100%
(1) Total net revenue consists of net interest income and non-interest income.
(2) Net income for our business segments is reported based on income from continuing operations, net of tax.
(3) Because we have some affordable housing tax-related investments that generate tax-exempt income or tax credits, we make certain
reclassifications to our Commercial Banking business results to present revenues on a taxable-equivalent basis.
(4) Includes the residual impact of the allocation of our centralized Corporate Treasury group activities to our business segments as well as
other items as described in “Note 19—Business Segments”.
CRITICAL ACCOUNTING POLICIES AND ESTIMATES
The preparation of financial statements in accordance with U.S. GAAP requires management to make a number
of judgments, estimates and assumptions that affect the reported amount of assets, liabilities, income and
expenses in the consolidated financial statements. Understanding our accounting policies and the extent to which
we use management judgment and estimates in applying these policies is integral to understanding our financial
statements. We provide a summary of our significant accounting policies under “Note 1—Summary of
Significant Accounting Policies”.
We have identified the following accounting policies as critical because they require significant judgments and
assumptions about highly complex and inherently uncertain matters and the use of reasonably different estimates
and assumptions could have a material impact on our reported results of operations or financial condition. These
critical accounting policies govern:
• Loan loss reserves
• Asset impairment
• Fair value of financial instruments
• Representation and warranty reserves
• Customer rewards reserves
• Income taxes
We evaluate our critical accounting estimates and judgments on an ongoing basis and update them, as necessary,
based on changing conditions. Management has discussed our critical accounting policies and estimates with the
Audit Committee of the Board of Directors.
Loan Loss Reserves
We maintain an allowance for loan and lease losses that represents management’s estimate of incurred loan and
lease losses inherent in our held-for-investment credit card, consumer banking and commercial banking loan
portfolios as of each balance sheet date, as well as a reserve for unfunded lending commitments, such as letters of
credit and financial guarantees, and binding unfunded loan commitments. We also maintain a separate reserve for
the uncollectible portion of billed finance charges and fees on credit card loans.
48