Capital One 2013 Annual Report Download - page 238
Download and view the complete annual report
Please find page 238 of the 2013 Capital One annual report below. You can navigate through the pages in the report by either clicking on the pages listed below, or by using the keyword search tool below to find specific information within the annual report.-
 1
1 -
2
-
3
-
4
-
5
-
6
-
7
-
8
-
9
-
10
-
11
-
12
-
13
-
14
-
15
-
16
-
17
-
18
-
19
-
20
-
21
-
22
-
23
-
24
-
25
-
26
-
27
-
28
-
29
-
30
-
31
-
32
-
33
-
34
-
35
-
36
-
37
-
38
-
39
-
40
-
41
-
42
-
43
-
44
-
45
-
46
-
47
-
48
-
49
-
50
-
51
-
52
-
53
-
54
-
55
-
56
-
57
-
58
-
59
-
60
-
61
-
62
-
63
-
64
-
65
-
66
-
67
-
68
-
69
-
70
-
71
-
72
-
73
-
74
-
75
-
76
-
77
-
78
-
79
-
80
-
81
-
82
-
83
-
84
-
85
-
86
-
87
-
88
-
89
-
90
-
91
-
92
-
93
-
94
-
95
-
96
-
97
-
98
-
99
-
100
-
101
-
102
-
103
-
104
-
105
-
106
-
107
-
108
-
109
-
110
-
111
-
112
-
113
-
114
-
115
-
116
-
117
-
118
-
119
-
120
-
121
-
122
-
123
-
124
-
125
-
126
-
127
-
128
-
129
-
130
-
131
-
132
-
133
-
134
-
135
-
136
-
137
-
138
-
139
-
140
-
141
-
142
-
143
-
144
-
145
-
146
-
147
-
148
-
149
-
150
-
151
-
152
-
153
-
154
-
155
-
156
-
157
-
158
-
159
-
160
-
161
-
162
-
163
-
164
-
165
-
166
-
167
-
168
-
169
-
170
-
171
-
172
-
173
-
174
-
175
-
176
-
177
-
178
-
179
-
180
-
181
-
182
-
183
-
184
-
185
-
186
-
187
-
188
-
189
-
190
-
191
-
192
-
193
-
194
-
195
-
196
-
197
-
198
-
199
-
200
-
201
-
202
-
203
-
204
-
205
-
206
-
207
-
208
-
209
-
210
-
211
-
212
-
213
-
214
-
215
-
216
-
217
-
218
-
219
-
220
-
221
-
222
-
223
-
224
-
225
-
226
-
227
-
 228
228 -
 229
229 -
 230
230 -
 231
231 -
 232
232 -
 233
233 -
 234
234 -
 235
235 -
 236
236 -
 237
237 -
 238
238 -
 239
239 -
 240
240 -
 241
241 -
 242
242 -
 243
243 -
 244
244 -
 245
245 -
 246
246 -
 247
247 -
 248
248 -
249
-
250
-
251
-
252
-
253
-
254
-
255
-
256
-
257
-
258
-
259
-
260
-
261
-
262
-
263
-
264
-
265
-
266
-
267
-
268
-
269
-
270
-
271
-
272
-
273
-
274
-
275
-
276
-
277
-
278
-
279
-
280
-
281
-
282
-
283
-
284
-
285
-
286
-
287
-
288
-
289
-
290
-
291
-
292
-
293
-
294
-
295
-
296
-
297
-
298
-
299
-
300
-
301
-
302
 |
 |

CAPITAL ONE FINANCIAL CORPORATION
NOTES TO CONSOLIDATED FINANCIAL STATEMENTS—(Continued)
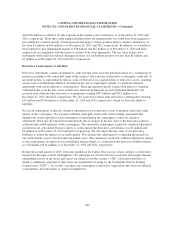
include an opportunity to receive from 0% to 200% of the target number of common shares. The number of
performance share units that will ultimately vest is contingent upon meeting specific performance goals over a
three-year period. The awards generally vest shortly after the end of the three-year period.
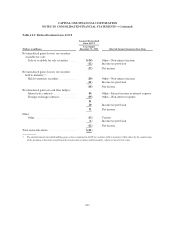
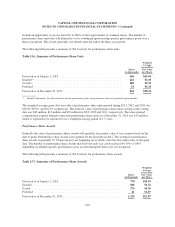
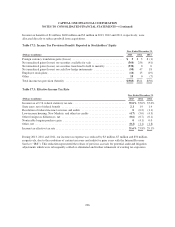
The following table presents a summary of 2013 activity for performance share units.
Table 15.6: Summary of Performance Share Units
Shares
(in thousands)
Weighted
Average
Grant Date
Fair Value
per Share
Unvested as of January 1, 2013 ............................................ 646 $45.05
Granted(1) ............................................................. 422 52.05
Vested(1) .............................................................. 180 36.55
Forfeited .............................................................. 24 46.26
Unvested as of December 31, 2013 ......................................... 864 $50.21
(1) Includes adjustments for achievement of specific performance goals for performance share units granted in prior periods.
The weighted-average grant date fair value of performance share units granted during 2013, 2012 and 2011 was
$52.05, $39.07 and $52.10, respectively. The total fair value of performance share units vesting on the vesting
date was $10 million, $21 million and $22 million in 2013, 2012 and 2011, respectively. The unrecognized
compensation expense related to unvested performance share units as of December 31, 2013 was $13 million,
which is expected to be amortized over a weighted-average period of 1.5 years.
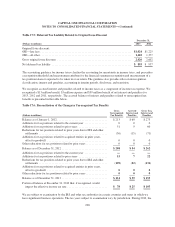
Performance Share Awards
Generally the value of performance share awards will equal the fair market value of our common stock on the
date of grant. Performance share awards were granted for the first time in 2012. The vesting for performance
share awards is generally 33 1/3 percent per year beginning on or shortly after the first anniversary of the grant
date. The number of performance share awards that will vest each year can be reduced by 50% or 100%
depending on whether specific performance goals are met during the three-year service period.
The following table presents a summary of 2013 activity for performance share awards.
Table 15.7: Summary of Performance Share Awards
Shares
(in thousands)
Weighted
Average
Grant Date
Fair Value
per Share
Unvested as of January 1, 2013 ............................................ 770 $45.93
Granted .............................................................. 686 56.32
Vested ............................................................... 276 46.36
Forfeited ............................................................. 41 52.07
Unvested as of December 31, 2013 ......................................... 1,139 $51.87
218