Capital One 2013 Annual Report Download - page 177
Download and view the complete annual report
Please find page 177 of the 2013 Capital One annual report below. You can navigate through the pages in the report by either clicking on the pages listed below, or by using the keyword search tool below to find specific information within the annual report.-
 1
1 -
2
-
3
-
4
-
5
-
6
-
7
-
8
-
9
-
10
-
11
-
12
-
13
-
14
-
15
-
16
-
17
-
18
-
19
-
20
-
21
-
22
-
23
-
24
-
25
-
26
-
27
-
28
-
29
-
30
-
31
-
32
-
33
-
34
-
35
-
36
-
37
-
38
-
39
-
40
-
41
-
42
-
43
-
44
-
45
-
46
-
47
-
48
-
49
-
50
-
51
-
52
-
53
-
54
-
55
-
56
-
57
-
58
-
59
-
60
-
61
-
62
-
63
-
64
-
65
-
66
-
67
-
68
-
69
-
70
-
71
-
72
-
73
-
74
-
75
-
76
-
77
-
78
-
79
-
80
-
81
-
82
-
83
-
84
-
85
-
86
-
87
-
88
-
89
-
90
-
91
-
92
-
93
-
94
-
95
-
96
-
97
-
98
-
99
-
100
-
101
-
102
-
103
-
104
-
105
-
106
-
107
-
108
-
109
-
110
-
111
-
112
-
113
-
114
-
115
-
116
-
117
-
118
-
119
-
120
-
121
-
122
-
123
-
124
-
125
-
126
-
127
-
128
-
129
-
130
-
131
-
132
-
133
-
134
-
135
-
136
-
137
-
138
-
139
-
140
-
141
-
142
-
143
-
144
-
145
-
146
-
147
-
148
-
149
-
150
-
151
-
152
-
153
-
154
-
155
-
156
-
157
-
158
-
159
-
160
-
161
-
162
-
163
-
164
-
165
-
166
-
 167
167 -
 168
168 -
 169
169 -
 170
170 -
 171
171 -
 172
172 -
 173
173 -
 174
174 -
 175
175 -
 176
176 -
 177
177 -
 178
178 -
 179
179 -
 180
180 -
 181
181 -
 182
182 -
 183
183 -
 184
184 -
 185
185 -
 186
186 -
 187
187 -
188
-
189
-
190
-
191
-
192
-
193
-
194
-
195
-
196
-
197
-
198
-
199
-
200
-
201
-
202
-
203
-
204
-
205
-
206
-
207
-
208
-
209
-
210
-
211
-
212
-
213
-
214
-
215
-
216
-
217
-
218
-
219
-
220
-
221
-
222
-
223
-
224
-
225
-
226
-
227
-
228
-
229
-
230
-
231
-
232
-
233
-
234
-
235
-
236
-
237
-
238
-
239
-
240
-
241
-
242
-
243
-
244
-
245
-
246
-
247
-
248
-
249
-
250
-
251
-
252
-
253
-
254
-
255
-
256
-
257
-
258
-
259
-
260
-
261
-
262
-
263
-
264
-
265
-
266
-
267
-
268
-
269
-
270
-
271
-
272
-
273
-
274
-
275
-
276
-
277
-
278
-
279
-
280
-
281
-
282
-
283
-
284
-
285
-
286
-
287
-
288
-
289
-
290
-
291
-
292
-
293
-
294
-
295
-
296
-
297
-
298
-
299
-
300
-
301
-
302
 |
 |

CAPITAL ONE FINANCIAL CORPORATION
NOTES TO CONSOLIDATED FINANCIAL STATEMENTS—(Continued)
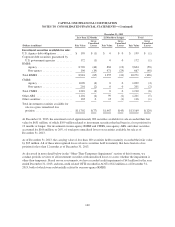
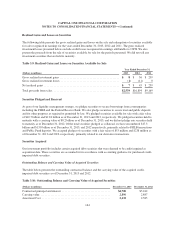
The carrying value of our investments in U.S. Treasury, agency securities and other securities guaranteed by the
U.S. government or agencies of the U.S. government represented 77% of our total investment securities as of
December 31, 2013 and 2012.
Our investment security portfolio includes securities available for sale as well as securities held to maturity. We
classify securities as available for sale or held to maturity based on our investment strategy and management’s
assessment of our intent and ability to hold the securities until maturity. In the third quarter of 2013, we
transferred securities with a fair value of $18.3 billion on the date of transfer, from securities available for sale to
securities held to maturity. We transferred these securities to held to maturity in consideration of changes to
regulatory capital requirements under the final Basel III capital standard, which will begin including changes in
AOCI due to securities price fluctuations. The securities included net pre-tax unrealized losses of $1.5 billion at
the date of transfer.
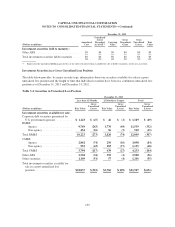
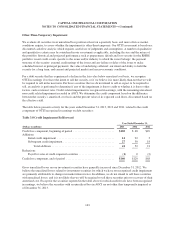
The table below presents the overview of our investment portfolio at December 31, 2013 and 2012.
Table 3.1 Overview of Investment Portfolio
(Dollars in millions) December 31, 2013 December 31, 2012
Securities available for sale, at fair value ............................ $41,800 $63,979
Securities held to maturity, at carrying value ......................... 19,132 9
Total investments ............................................... $60,932 $63,988
The table below presents the amortized cost, gross unrealized gains and losses, and fair value of securities
available for sale at December 31, 2013 and 2012.
Table 3.2 Investment Securities Available for Sale
December 31, 2013
(Dollars in millions)
Amortized
Cost
Gross
Unrealized
Gains
Gross
Unrealized
Losses(1)
Fair
Value
Investment securities available for sale:
U.S. Treasury debt obligations ............................. $ 831 $ 2 $ 0 $ 833
U.S. Agency debt obligations .............................. 10 0 1
Corporate debt securities guaranteed by U.S. government
agencies ............................................. 1,282 1 (49) 1,234
Residential mortgage-backed securities (“RMBS”):
Agency ............................................ 21,572 239 (332) 21,479
Non-agency ........................................ 3,165 450 (15) 3,600
Total RMBS ............................................ 24,737 689 (347) 25,079
Commercial mortgage-backed securities (“CMBS”):
Agency ............................................ 4,262 20 (84) 4,198
Non-agency ........................................ 1,854 14 (60) 1,808
Total CMBS ............................................ 6,116 34 (144) 6,006
Other assets backed securities (“ABS”)(2) ..................... 7,123 49 (36) 7,136
Other securities(3) ........................................ 1,542 24 (55) 1,511
Total investment securities available for sale .................. $41,632 $799 $(631) $41,800
157