Capital One 2013 Annual Report Download - page 82
Download and view the complete annual report
Please find page 82 of the 2013 Capital One annual report below. You can navigate through the pages in the report by either clicking on the pages listed below, or by using the keyword search tool below to find specific information within the annual report.-
 1
1 -
2
-
3
-
4
-
5
-
6
-
7
-
8
-
9
-
10
-
11
-
12
-
13
-
14
-
15
-
16
-
17
-
18
-
19
-
20
-
21
-
22
-
23
-
24
-
25
-
26
-
27
-
28
-
29
-
30
-
31
-
32
-
33
-
34
-
35
-
36
-
37
-
38
-
39
-
40
-
41
-
42
-
43
-
44
-
45
-
46
-
47
-
48
-
49
-
50
-
51
-
52
-
53
-
54
-
55
-
56
-
57
-
58
-
59
-
60
-
61
-
62
-
63
-
64
-
65
-
66
-
67
-
68
-
69
-
70
-
71
-
 72
72 -
 73
73 -
 74
74 -
 75
75 -
 76
76 -
 77
77 -
 78
78 -
 79
79 -
 80
80 -
 81
81 -
 82
82 -
 83
83 -
 84
84 -
 85
85 -
 86
86 -
 87
87 -
 88
88 -
 89
89 -
 90
90 -
 91
91 -
 92
92 -
93
-
94
-
95
-
96
-
97
-
98
-
99
-
100
-
101
-
102
-
103
-
104
-
105
-
106
-
107
-
108
-
109
-
110
-
111
-
112
-
113
-
114
-
115
-
116
-
117
-
118
-
119
-
120
-
121
-
122
-
123
-
124
-
125
-
126
-
127
-
128
-
129
-
130
-
131
-
132
-
133
-
134
-
135
-
136
-
137
-
138
-
139
-
140
-
141
-
142
-
143
-
144
-
145
-
146
-
147
-
148
-
149
-
150
-
151
-
152
-
153
-
154
-
155
-
156
-
157
-
158
-
159
-
160
-
161
-
162
-
163
-
164
-
165
-
166
-
167
-
168
-
169
-
170
-
171
-
172
-
173
-
174
-
175
-
176
-
177
-
178
-
179
-
180
-
181
-
182
-
183
-
184
-
185
-
186
-
187
-
188
-
189
-
190
-
191
-
192
-
193
-
194
-
195
-
196
-
197
-
198
-
199
-
200
-
201
-
202
-
203
-
204
-
205
-
206
-
207
-
208
-
209
-
210
-
211
-
212
-
213
-
214
-
215
-
216
-
217
-
218
-
219
-
220
-
221
-
222
-
223
-
224
-
225
-
226
-
227
-
228
-
229
-
230
-
231
-
232
-
233
-
234
-
235
-
236
-
237
-
238
-
239
-
240
-
241
-
242
-
243
-
244
-
245
-
246
-
247
-
248
-
249
-
250
-
251
-
252
-
253
-
254
-
255
-
256
-
257
-
258
-
259
-
260
-
261
-
262
-
263
-
264
-
265
-
266
-
267
-
268
-
269
-
270
-
271
-
272
-
273
-
274
-
275
-
276
-
277
-
278
-
279
-
280
-
281
-
282
-
283
-
284
-
285
-
286
-
287
-
288
-
289
-
290
-
291
-
292
-
293
-
294
-
295
-
296
-
297
-
298
-
299
-
300
-
301
-
302
 |
 |
Non-interest expense of $12.5 billion in 2013 increased by $568 million, or 5%, from 2012. The increase
reflected higher operating expenses attributable to the acquired businesses and the growth in our auto loan and
commercial loan portfolios. These increases were partially offset by a reduction in acquisition-related costs and
other non-interest expenses.
Non-interest expense of $11.9 billion for 2012 increased $2.6 billion, or 28%, from 2011. The increase was
primarily due to higher operating expenses and merger-related costs related to our recent acquisitions, increased
salaries and associate benefits attributable to increased headcount, higher infrastructure costs attributable to
acquired businesses and our continued investment in our auto loan business and increased amortization of
intangibles resulting from the ING Direct and 2012 U.S. card acquisitions. We recorded PCCR intangible
amortization expense related to the 2012 U.S. card acquisition of $350 million in 2012. We recorded other
intangible amortization expense related to the ING Direct and 2012 U.S. card acquisitions of $147 million in
2012.
Income Taxes
We recorded an income tax provision of $2.0 billion (31.6% effective income tax rate) in 2013, compared with
an income tax provision of $1.3 billion (25.8% effective income tax rate) in 2012 and income tax provision of
$1.3 billion (29.1% effective income tax rate) in 2011. Our effective tax rate on income from continuing
operations varies between periods due, in part, to fluctuations in our pre-tax earnings, which affects the relative
tax benefit of tax-exempt income, tax credits and other permanent tax items.
The increase in our effective income tax rate in 2013 from 2012 was primarily attributable to increased pre-tax
income, which reduced the relative benefit of tax-exempt income, tax credits and other permanent items, and the
absence of discrete tax benefits of $251 million recorded in 2012 for the non-taxable bargain purchase gain of
$594 million related to the acquisition of ING Direct, a deferred tax benefit for changes in our state tax position
resulting from the 2012 U.S. card acquisition and consolidation of ING Bank, fsb with our existing banking
operations, and the resolution of certain tax issues and audits. In comparison, we recorded $16 million of discrete
tax expense in 2013 primarily related to adjustments to acquired tax attributes based upon the final tax returns
filed, changes to enacted statutory tax rates, and resolution of certain tax issues and audits.
The decrease in our effective income tax rate in 2012 from 2011 was primarily attributable to the recording of the
discrete tax benefits of $251 million described above in 2012. In comparison, in 2011 we recorded discrete tax
benefits of $121 million, primarily related to the release of valuation allowances against certain state deferred tax
assets and net operating loss carry-forwards, as well as the resolution of certain tax issues and audits.
Our effective income tax rate, excluding the impact of discrete tax items discussed above, was 31.4%, 30.7% and
31.7% in 2013, 2012, and 2011, respectively. The higher effective income tax rate before discrete items in 2013
and 2011 in comparison to 2012 was primarily due to lower affordable housing and other business tax credits as a
percentage of pre-tax earnings.
We provide additional information on items affecting our income taxes and effective tax rate under “Note 17—
Income Taxes.”
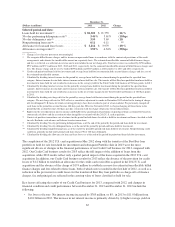
Loss from Discontinued Operations, Net of Tax
Loss from discontinued operations reflects ongoing costs, which primarily consist of mortgage loan repurchase
representation and warranty charges related to the mortgage origination operations of GreenPoint’s wholesale
mortgage banking unit that we closed in 2007.
We recorded a loss from discontinued operations, net of tax, of $233 million, $217 million and $106 million in
2013, 2012 and 2011, respectively. The variance in the loss from discontinued operations is attributable to the
62