Capital One 2013 Annual Report Download - page 211
Download and view the complete annual report
Please find page 211 of the 2013 Capital One annual report below. You can navigate through the pages in the report by either clicking on the pages listed below, or by using the keyword search tool below to find specific information within the annual report.-
 1
1 -
2
-
3
-
4
-
5
-
6
-
7
-
8
-
9
-
10
-
11
-
12
-
13
-
14
-
15
-
16
-
17
-
18
-
19
-
20
-
21
-
22
-
23
-
24
-
25
-
26
-
27
-
28
-
29
-
30
-
31
-
32
-
33
-
34
-
35
-
36
-
37
-
38
-
39
-
40
-
41
-
42
-
43
-
44
-
45
-
46
-
47
-
48
-
49
-
50
-
51
-
52
-
53
-
54
-
55
-
56
-
57
-
58
-
59
-
60
-
61
-
62
-
63
-
64
-
65
-
66
-
67
-
68
-
69
-
70
-
71
-
72
-
73
-
74
-
75
-
76
-
77
-
78
-
79
-
80
-
81
-
82
-
83
-
84
-
85
-
86
-
87
-
88
-
89
-
90
-
91
-
92
-
93
-
94
-
95
-
96
-
97
-
98
-
99
-
100
-
101
-
102
-
103
-
104
-
105
-
106
-
107
-
108
-
109
-
110
-
111
-
112
-
113
-
114
-
115
-
116
-
117
-
118
-
119
-
120
-
121
-
122
-
123
-
124
-
125
-
126
-
127
-
128
-
129
-
130
-
131
-
132
-
133
-
134
-
135
-
136
-
137
-
138
-
139
-
140
-
141
-
142
-
143
-
144
-
145
-
146
-
147
-
148
-
149
-
150
-
151
-
152
-
153
-
154
-
155
-
156
-
157
-
158
-
159
-
160
-
161
-
162
-
163
-
164
-
165
-
166
-
167
-
168
-
169
-
170
-
171
-
172
-
173
-
174
-
175
-
176
-
177
-
178
-
179
-
180
-
181
-
182
-
183
-
184
-
185
-
186
-
187
-
188
-
189
-
190
-
191
-
192
-
193
-
194
-
195
-
196
-
197
-
198
-
199
-
200
-
 201
201 -
 202
202 -
 203
203 -
 204
204 -
 205
205 -
 206
206 -
 207
207 -
 208
208 -
 209
209 -
 210
210 -
 211
211 -
 212
212 -
 213
213 -
 214
214 -
 215
215 -
 216
216 -
 217
217 -
 218
218 -
 219
219 -
 220
220 -
 221
221 -
222
-
223
-
224
-
225
-
226
-
227
-
228
-
229
-
230
-
231
-
232
-
233
-
234
-
235
-
236
-
237
-
238
-
239
-
240
-
241
-
242
-
243
-
244
-
245
-
246
-
247
-
248
-
249
-
250
-
251
-
252
-
253
-
254
-
255
-
256
-
257
-
258
-
259
-
260
-
261
-
262
-
263
-
264
-
265
-
266
-
267
-
268
-
269
-
270
-
271
-
272
-
273
-
274
-
275
-
276
-
277
-
278
-
279
-
280
-
281
-
282
-
283
-
284
-
285
-
286
-
287
-
288
-
289
-
290
-
291
-
292
-
293
-
294
-
295
-
296
-
297
-
298
-
299
-
300
-
301
-
302
 |
 |

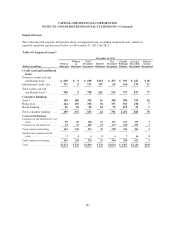
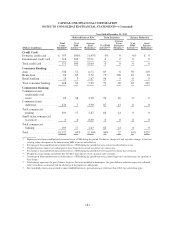
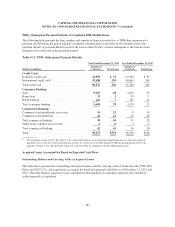
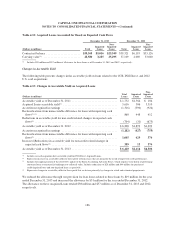
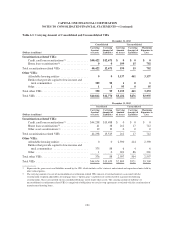
CAPITAL ONE FINANCIAL CORPORATION
NOTES TO CONSOLIDATED FINANCIAL STATEMENTS—(Continued)
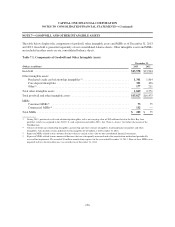
Table 6.1: Carrying Amount of Consolidated and Unconsolidated VIEs
December 31, 2013
Consolidated Unconsolidated
(Dollars in millions)
Carrying
Amount
of Assets
Carrying
Amount of
Liabilities
Carrying
Amount
of Assets
Carrying
Amount of
Liabilities
Maximum
Exposure to
Loss
Securitization-related VIEs:
Credit card loan securitizations(1) ............... $40,422 $12,671 $ 0 $ 0 $ 0
Home loan securitizations(2) ................... 0 0 199 15 702
Total securitization-related VIEs ................... 40,422 12,671 199 15 702
Other VIEs:
Affordable housing entities ................... 0 0 3,137 461 3,137
Entities that provide capital to low-income and
rural communities ........................ 389 98 1 0 1
Other .................................... 1 1 95 0 95
Total other VIEs ................................ 390 99 3,233 461 3,233
Total VIEs .................................... $40,812 $12,770 $3,432 $476 $3,935
December 31, 2012
Consolidated Unconsolidated
(Dollars in millions)
Carrying
Amount
of Assets
Carrying
Amount of
Liabilities
Carrying
Amount
of Assets
Carrying
Amount of
Liabilities
Maximum
Exposure to
Loss
Securitization-related VIEs:
Credit card loan securitizations(1) ............... $44,238 $13,488 $ 0 $ 0 $ 0
Home loan securitizations(2) ................... 41 38 212 17 712
Other asset securitizations(1) .................. 19 19 0 0 0
Total securitization-related VIEs ................... 44,298 13,545 212 17 712
Other VIEs:
Affordable housing entities ................... 0 0 2,390 414 2,390
Entities that provide capital to low-income and
rural communities ........................ 375 88 6 4 6
Other .................................... 1 0 201 86 201
Total other VIEs ................................ 376 88 2,597 504 2,597
Total VIEs .................................... $44,674 $13,633 $2,809 $521 $3,309
(1) Represents the gross assets and liabilities owned by the VIE, which includes seller’s interest and retained and repurchased notes held by
other related parties.
(2) The carrying amount of assets of unconsolidated securitization-related VIEs consists of retained interests associated with the
securitization of option-adjustable rate mortgage loans (“option-arms”) and letters of credit related to manufactured housing
securitizations. These are reported on our consolidated balance sheets under other assets. The carrying amount of liabilities of
unconsolidated securitization-related VIEs is comprised of obligations on certain swap agreements associated with the securitization of
manufactured housing loans.
191