Capital One 2013 Annual Report Download - page 116
Download and view the complete annual report
Please find page 116 of the 2013 Capital One annual report below. You can navigate through the pages in the report by either clicking on the pages listed below, or by using the keyword search tool below to find specific information within the annual report.-
 1
1 -
2
-
3
-
4
-
5
-
6
-
7
-
8
-
9
-
10
-
11
-
12
-
13
-
14
-
15
-
16
-
17
-
18
-
19
-
20
-
21
-
22
-
23
-
24
-
25
-
26
-
27
-
28
-
29
-
30
-
31
-
32
-
33
-
34
-
35
-
36
-
37
-
38
-
39
-
40
-
41
-
42
-
43
-
44
-
45
-
46
-
47
-
48
-
49
-
50
-
51
-
52
-
53
-
54
-
55
-
56
-
57
-
58
-
59
-
60
-
61
-
62
-
63
-
64
-
65
-
66
-
67
-
68
-
69
-
70
-
71
-
72
-
73
-
74
-
75
-
76
-
77
-
78
-
79
-
80
-
81
-
82
-
83
-
84
-
85
-
86
-
87
-
88
-
89
-
90
-
91
-
92
-
93
-
94
-
95
-
96
-
97
-
98
-
99
-
100
-
101
-
102
-
103
-
104
-
105
-
 106
106 -
 107
107 -
 108
108 -
 109
109 -
 110
110 -
 111
111 -
 112
112 -
 113
113 -
 114
114 -
 115
115 -
 116
116 -
 117
117 -
 118
118 -
 119
119 -
 120
120 -
 121
121 -
 122
122 -
 123
123 -
 124
124 -
 125
125 -
 126
126 -
127
-
128
-
129
-
130
-
131
-
132
-
133
-
134
-
135
-
136
-
137
-
138
-
139
-
140
-
141
-
142
-
143
-
144
-
145
-
146
-
147
-
148
-
149
-
150
-
151
-
152
-
153
-
154
-
155
-
156
-
157
-
158
-
159
-
160
-
161
-
162
-
163
-
164
-
165
-
166
-
167
-
168
-
169
-
170
-
171
-
172
-
173
-
174
-
175
-
176
-
177
-
178
-
179
-
180
-
181
-
182
-
183
-
184
-
185
-
186
-
187
-
188
-
189
-
190
-
191
-
192
-
193
-
194
-
195
-
196
-
197
-
198
-
199
-
200
-
201
-
202
-
203
-
204
-
205
-
206
-
207
-
208
-
209
-
210
-
211
-
212
-
213
-
214
-
215
-
216
-
217
-
218
-
219
-
220
-
221
-
222
-
223
-
224
-
225
-
226
-
227
-
228
-
229
-
230
-
231
-
232
-
233
-
234
-
235
-
236
-
237
-
238
-
239
-
240
-
241
-
242
-
243
-
244
-
245
-
246
-
247
-
248
-
249
-
250
-
251
-
252
-
253
-
254
-
255
-
256
-
257
-
258
-
259
-
260
-
261
-
262
-
263
-
264
-
265
-
266
-
267
-
268
-
269
-
270
-
271
-
272
-
273
-
274
-
275
-
276
-
277
-
278
-
279
-
280
-
281
-
282
-
283
-
284
-
285
-
286
-
287
-
288
-
289
-
290
-
291
-
292
-
293
-
294
-
295
-
296
-
297
-
298
-
299
-
300
-
301
-
302
 |
 |

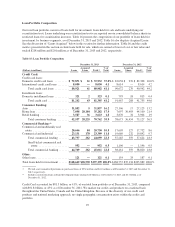
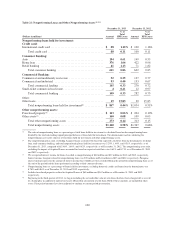
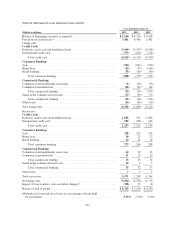
Consumer Banking accounted for $70.8 billion, or 36%, of our loan portfolio as of December 31, 2013,
compared with $75.1 billion, or 37%, of our loan portfolio as of December 31, 2012. The auto portfolio is
originated primarily on a national basis, with additional originations through our retail branch network. The
home loan portfolio is concentrated in California, New York, Illinois, Maryland, New Jersey, Virginia, and
Florida which reflects the characteristics of the ING Direct portfolio that comprises the majority of our home
loans. Retail banking includes small business loans and other consumer lending products originated through our
branch network.
Commercial Banking represented $45.0 billion, or 23%, of our loan portfolio as of December 31, 2013,
compared with $38.8 billion, or 19%, as of December 31, 2012. We operate our Commercial Banking business
primarily in geographic regions where we maintain retail bank branches. Accordingly, the portfolio is
concentrated in New York, Louisiana and Texas, which represent our largest retail banking markets. Our small-
ticket commercial real estate portfolio, which was originated on a national basis through a broker network, is in a
run-off mode.
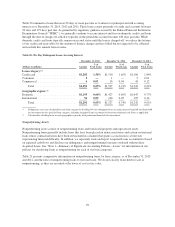
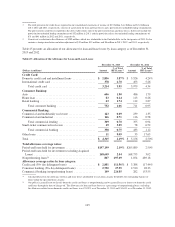
We provide additional information on the geographic concentration, by loan category, of our loan portfolio in
“Note 4—Loans.”
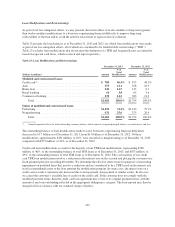
Loans Acquired in Business Acquisitions
As noted above, our portfolio of loans held for investment includes loans acquired in the CCB, ING Direct and
2012 U.S. card acquisitions. These loans were recorded at fair value as of the date of each acquisition. We elect
to account for purchased loans using the guidance for accounting for purchased credit-impaired loans, which is
based on expected cash flows, unless specifically scoped out of the guidance.
See “Note 1—Summary of Significant Accounting Policies—Loans” for additional information on our
accounting for loans, including purchased loans. See “Note 4—Loans” and “Note 5—Allowance for Loan and
Lease Losses” for additional information on the credit quality of our loan portfolio.
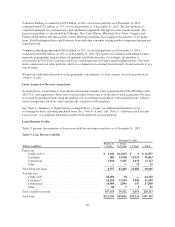
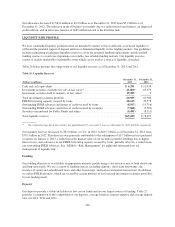
Loan Maturity Profile
Table 17 presents the maturities of loans in our held-for-investment portfolio as of December 31, 2013.
Table 17: Loan Maturity Schedule
December 31, 2013
(Dollars in millions)
Due Up to
1 Year
> 1 Year
to 5 Years > 5 Years Total
Fixed rate:
Credit card(1)(2) ...................................... $ 2,841 $14,025 $ 9 $ 16,875
Consumer .......................................... 682 23,968 14,413 39,063
Commercial ........................................ 1,034 5,456 6,633 13,123
Other .............................................. — — 25 25
Total fixed-rate loans ..................................... 4,557 43,449 21,080 69,086
Variable rate:
Credit card(1) ........................................ 64,400 30 — 64,430
Consumer(3) ......................................... 14,260 13,539 3,900 31,699
Commercial ........................................ 28,885 2,856 147 31,888
Other .............................................. 80 7 9 96
Total variable-rate loans ................................... 107,625 16,432 4,056 128,113
Total loans ............................................. $112,182 $59,881 $25,136 $197,199
96