Capital One 2013 Annual Report Download - page 156
Download and view the complete annual report
Please find page 156 of the 2013 Capital One annual report below. You can navigate through the pages in the report by either clicking on the pages listed below, or by using the keyword search tool below to find specific information within the annual report.-
 1
1 -
2
-
3
-
4
-
5
-
6
-
7
-
8
-
9
-
10
-
11
-
12
-
13
-
14
-
15
-
16
-
17
-
18
-
19
-
20
-
21
-
22
-
23
-
24
-
25
-
26
-
27
-
28
-
29
-
30
-
31
-
32
-
33
-
34
-
35
-
36
-
37
-
38
-
39
-
40
-
41
-
42
-
43
-
44
-
45
-
46
-
47
-
48
-
49
-
50
-
51
-
52
-
53
-
54
-
55
-
56
-
57
-
58
-
59
-
60
-
61
-
62
-
63
-
64
-
65
-
66
-
67
-
68
-
69
-
70
-
71
-
72
-
73
-
74
-
75
-
76
-
77
-
78
-
79
-
80
-
81
-
82
-
83
-
84
-
85
-
86
-
87
-
88
-
89
-
90
-
91
-
92
-
93
-
94
-
95
-
96
-
97
-
98
-
99
-
100
-
101
-
102
-
103
-
104
-
105
-
106
-
107
-
108
-
109
-
110
-
111
-
112
-
113
-
114
-
115
-
116
-
117
-
118
-
119
-
120
-
121
-
122
-
123
-
124
-
125
-
126
-
127
-
128
-
129
-
130
-
131
-
132
-
133
-
134
-
135
-
136
-
137
-
138
-
139
-
140
-
141
-
142
-
143
-
144
-
145
-
 146
146 -
 147
147 -
 148
148 -
 149
149 -
 150
150 -
 151
151 -
 152
152 -
 153
153 -
 154
154 -
 155
155 -
 156
156 -
 157
157 -
 158
158 -
 159
159 -
 160
160 -
 161
161 -
 162
162 -
 163
163 -
 164
164 -
 165
165 -
 166
166 -
167
-
168
-
169
-
170
-
171
-
172
-
173
-
174
-
175
-
176
-
177
-
178
-
179
-
180
-
181
-
182
-
183
-
184
-
185
-
186
-
187
-
188
-
189
-
190
-
191
-
192
-
193
-
194
-
195
-
196
-
197
-
198
-
199
-
200
-
201
-
202
-
203
-
204
-
205
-
206
-
207
-
208
-
209
-
210
-
211
-
212
-
213
-
214
-
215
-
216
-
217
-
218
-
219
-
220
-
221
-
222
-
223
-
224
-
225
-
226
-
227
-
228
-
229
-
230
-
231
-
232
-
233
-
234
-
235
-
236
-
237
-
238
-
239
-
240
-
241
-
242
-
243
-
244
-
245
-
246
-
247
-
248
-
249
-
250
-
251
-
252
-
253
-
254
-
255
-
256
-
257
-
258
-
259
-
260
-
261
-
262
-
263
-
264
-
265
-
266
-
267
-
268
-
269
-
270
-
271
-
272
-
273
-
274
-
275
-
276
-
277
-
278
-
279
-
280
-
281
-
282
-
283
-
284
-
285
-
286
-
287
-
288
-
289
-
290
-
291
-
292
-
293
-
294
-
295
-
296
-
297
-
298
-
299
-
300
-
301
-
302
 |
 |

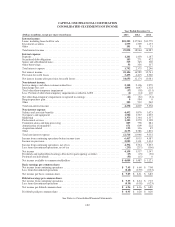
CAPITAL ONE FINANCIAL CORPORATION
CONSOLIDATED STATEMENTS OF CASH FLOWS
Year Ended December 31,
(Dollars in millions) 2013 2012 2011
Operating activities:
Income from continuing operations, net of tax ........................................ $ 4,392 $ 3,734 $ 3,253
Loss from discontinued operations, net of tax ......................................... (233) (217) (106)
Net income .................................................................... 4,159 3,517 3,147
Adjustments to reconcile net income to cash provided by operating activities:
Provision for credit losses .................................................... 3,453 4,415 2,360
Depreciation and amortization, net ............................................. 2,065 1,862 579
Net gains on sales of securities available for sale .................................. (7) (45) (259)
Impairment losses on securities available for sale .................................. 41 52 21
Bargain purchase gain ....................................................... 0(594) 0
Loans held for sale: .........................................................
Originations and purchases ............................................... (2,276) (1,699) (1,031)
Gain (losses) on sales .................................................... (32) (58) (28)
Proceeds from sales and paydowns ......................................... 2,469 2,692 1,086
Stock plan compensation expense .............................................. 240 199 189
Changes in operating assets and liabilities, net of effects of acquisitions: ...............
(Increase) decrease in interest receivable ..................................... 276 (495) 41
(Increase) decrease in other assets .......................................... (245) (1,033) (126)
Increase (decrease) in interest payable ....................................... (143) (47) (22)
Increase in other liabilities ................................................ 239 798 1,403
Net cash (used in) provided by discontinued operations ............................. (255) (40) 95
Net cash provided by operating activities ........................................ 9,984 9,524 7,455
Investing activities:
Purchases of securities ........................................................... (16,062) (29,257) (16,060)
Proceeds from paydowns and maturities of securities ................................... 13,930 17,779 9,710
Proceeds from sales of securities ................................................... 2,539 16,894 9,169
Net increase in loans held for investment ............................................ 2,291 (7,605) (13,777)
Principal recoveries of loans previously charged off .................................... 1,589 1,538 1,543
Additions of premises and equipment ............................................... (818) (560) (315)
Net cash paid for acquisitions ..................................................... (204) (17,603) (1,444)
Net cash provided by other investing activities ........................................ 456 00
Net cash used in investing activities ............................................ 3,721 (18,814) (11,174)
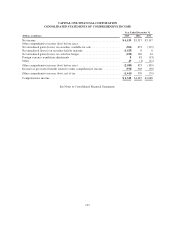
Financing activities:
(Decrease) increase in restricted cash for securitization investors .......................... (446) 363 811
Net increase (decrease) in deposits ................................................. (7,972) (156) 6,010
Issuance of securitized debt obligations .............................................. 2,200 00
Maturities and paydowns of securitized debt obligations ................................ (3,309) (5,129) (10,388)
Issuance of senior and subordinated notes and junior subordinated debt .................... 2,063 2,248 2,992
Redemption of junior subordinated debentures ........................................ (3,641) 00
Maturities and redemptions of senior and subordinate notes .............................. (777) (632) (855)
Net increase (decrease) in other borrowings .......................................... (5,144) 13,819 5,774
Net proceeds from issuances of common stock ........................................ 81 3,233 40
Net proceeds from issuances of preferred stock ....................................... 0853 0
Proceeds from share-based payment activities ........................................ 114 80 57
Dividends paid on common stock .................................................. (555) (111) (91)
Dividends paid on preferred stock .................................................. (53) (15) 0
Purchases of treasury stock ....................................................... (1,033) (43) (42)
Net cash provided by (used in) financing activities ................................. (18,472) 14,510 4,308
Increase (decrease) in cash and cash equivalents ....................................... (4,767) 5,220 589
Cash and cash equivalents at beginning of the period ................................... 11,058 5,838 5,249
Cash and cash equivalents at end of the period ........................................ $ 6,291 $ 11,058 $ 5,838
Supplemental cash flow information:
Non-cash items:
Fair value of common stock issued in business acquisition ........................... $0$ 2,638 $ 0
Net transfers of loans held for investment to loans held for sale ....................... 6,846 94 0
Transfer from securities available for sale to securities held to maturity ................ 18,275 00
Redemption of senior and subordinated notes ..................................... (1,969) 00
Issuance of senior and subordinated notes ........................................ 1,968 00
Interest paid ................................................................... (1,936) (2,391) (2,267)
Income tax paid ................................................................ (1,721) (1,621) (923)
See Notes to Consolidated Financial Statements.
136