Capital One 2013 Annual Report Download - page 252
Download and view the complete annual report
Please find page 252 of the 2013 Capital One annual report below. You can navigate through the pages in the report by either clicking on the pages listed below, or by using the keyword search tool below to find specific information within the annual report.-
 1
1 -
2
-
3
-
4
-
5
-
6
-
7
-
8
-
9
-
10
-
11
-
12
-
13
-
14
-
15
-
16
-
17
-
18
-
19
-
20
-
21
-
22
-
23
-
24
-
25
-
26
-
27
-
28
-
29
-
30
-
31
-
32
-
33
-
34
-
35
-
36
-
37
-
38
-
39
-
40
-
41
-
42
-
43
-
44
-
45
-
46
-
47
-
48
-
49
-
50
-
51
-
52
-
53
-
54
-
55
-
56
-
57
-
58
-
59
-
60
-
61
-
62
-
63
-
64
-
65
-
66
-
67
-
68
-
69
-
70
-
71
-
72
-
73
-
74
-
75
-
76
-
77
-
78
-
79
-
80
-
81
-
82
-
83
-
84
-
85
-
86
-
87
-
88
-
89
-
90
-
91
-
92
-
93
-
94
-
95
-
96
-
97
-
98
-
99
-
100
-
101
-
102
-
103
-
104
-
105
-
106
-
107
-
108
-
109
-
110
-
111
-
112
-
113
-
114
-
115
-
116
-
117
-
118
-
119
-
120
-
121
-
122
-
123
-
124
-
125
-
126
-
127
-
128
-
129
-
130
-
131
-
132
-
133
-
134
-
135
-
136
-
137
-
138
-
139
-
140
-
141
-
142
-
143
-
144
-
145
-
146
-
147
-
148
-
149
-
150
-
151
-
152
-
153
-
154
-
155
-
156
-
157
-
158
-
159
-
160
-
161
-
162
-
163
-
164
-
165
-
166
-
167
-
168
-
169
-
170
-
171
-
172
-
173
-
174
-
175
-
176
-
177
-
178
-
179
-
180
-
181
-
182
-
183
-
184
-
185
-
186
-
187
-
188
-
189
-
190
-
191
-
192
-
193
-
194
-
195
-
196
-
197
-
198
-
199
-
200
-
201
-
202
-
203
-
204
-
205
-
206
-
207
-
208
-
209
-
210
-
211
-
212
-
213
-
214
-
215
-
216
-
217
-
218
-
219
-
220
-
221
-
222
-
223
-
224
-
225
-
226
-
227
-
228
-
229
-
230
-
231
-
232
-
233
-
234
-
235
-
236
-
237
-
238
-
239
-
240
-
241
-
 242
242 -
 243
243 -
 244
244 -
 245
245 -
 246
246 -
 247
247 -
 248
248 -
 249
249 -
 250
250 -
 251
251 -
 252
252 -
 253
253 -
 254
254 -
 255
255 -
 256
256 -
 257
257 -
 258
258 -
 259
259 -
 260
260 -
 261
261 -
 262
262 -
263
-
264
-
265
-
266
-
267
-
268
-
269
-
270
-
271
-
272
-
273
-
274
-
275
-
276
-
277
-
278
-
279
-
280
-
281
-
282
-
283
-
284
-
285
-
286
-
287
-
288
-
289
-
290
-
291
-
292
-
293
-
294
-
295
-
296
-
297
-
298
-
299
-
300
-
301
-
302
 |
 |

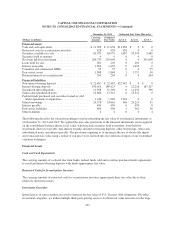
CAPITAL ONE FINANCIAL CORPORATION
NOTES TO CONSOLIDATED FINANCIAL STATEMENTS—(Continued)
December 31, 2012
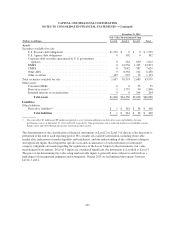
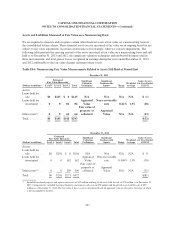
Fair Value Measurements Using
(Dollars in millions) Level 1 Level 2 Level 3 Total
Assets
Securities available for sale:
U.S. Treasury debt obligations .............................. $1,552 $ 0 $ 0 $ 1,552
U.S. Agency debt obligations ............................... 0 302 0 302
Corporate debt securities guaranteed by U.S. government
agencies .............................................. 0 362 650 1,012
RMBS ................................................. 0 42,538 1,335 43,873
CMBS ................................................. 0 7,042 587 7,629
Other ABS .............................................. 0 8,356 102 8,458
Other securities .......................................... 145 993 15 1,153
Total securities available for sale ................................ 1,697 59,593 2,689 63,979
Other assets:
Consumer MSRs ......................................... 0 0 55 55
Derivative assets(1) ........................................ 1 1,757 90 1,848
Retained interests in securitizations .......................... 0 0 204 204
Total assets ......................................... $1,698 $61,350 $3,038 $66,086
Liabilities
Other liabilities:
Derivative liabilities(1) ..................................... $ 1 $ 361 $ 38 $ 400
Total liabilities ...................................... $ 1 $ 361 $ 38 $ 400
(1) Does not reflect $1 million and $9 million recognized as a net valuation allowance on derivative assets and liabilities for non-
performance risk as of December 31, 2013 and 2012, respectively. Non-performance risk is reflected in other assets/liabilities on the
balance sheet and offset through the income statement in other income.
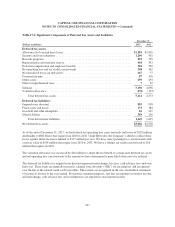
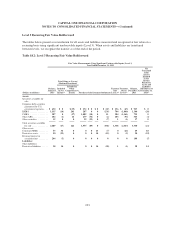
The determination of the classification of financial instruments in Level 2 or Level 3 of the fair value hierarchy is
performed at the end of each reporting period. We consider all available information, including observable
market data, indications of market liquidity and orderliness, and our understanding of the valuation techniques
and significant inputs. Based upon the specific facts and circumstances of each instrument or instrument
category, judgments are made regarding the significance of the Level 3 inputs to the instruments’ fair value
measurement in its entirety. If Level 3 inputs are considered significant, the instrument is classified as Level 3.
The process for determining fair value using unobservable inputs is generally more subjective and involves a
high degree of management judgment and assumptions. During 2013 we had minimal movements between
Levels 1 and 2.
232