Capital One 2013 Annual Report Download - page 154
Download and view the complete annual report
Please find page 154 of the 2013 Capital One annual report below. You can navigate through the pages in the report by either clicking on the pages listed below, or by using the keyword search tool below to find specific information within the annual report.-
 1
1 -
2
-
3
-
4
-
5
-
6
-
7
-
8
-
9
-
10
-
11
-
12
-
13
-
14
-
15
-
16
-
17
-
18
-
19
-
20
-
21
-
22
-
23
-
24
-
25
-
26
-
27
-
28
-
29
-
30
-
31
-
32
-
33
-
34
-
35
-
36
-
37
-
38
-
39
-
40
-
41
-
42
-
43
-
44
-
45
-
46
-
47
-
48
-
49
-
50
-
51
-
52
-
53
-
54
-
55
-
56
-
57
-
58
-
59
-
60
-
61
-
62
-
63
-
64
-
65
-
66
-
67
-
68
-
69
-
70
-
71
-
72
-
73
-
74
-
75
-
76
-
77
-
78
-
79
-
80
-
81
-
82
-
83
-
84
-
85
-
86
-
87
-
88
-
89
-
90
-
91
-
92
-
93
-
94
-
95
-
96
-
97
-
98
-
99
-
100
-
101
-
102
-
103
-
104
-
105
-
106
-
107
-
108
-
109
-
110
-
111
-
112
-
113
-
114
-
115
-
116
-
117
-
118
-
119
-
120
-
121
-
122
-
123
-
124
-
125
-
126
-
127
-
128
-
129
-
130
-
131
-
132
-
133
-
134
-
135
-
136
-
137
-
138
-
139
-
140
-
141
-
142
-
143
-
 144
144 -
 145
145 -
 146
146 -
 147
147 -
 148
148 -
 149
149 -
 150
150 -
 151
151 -
 152
152 -
 153
153 -
 154
154 -
 155
155 -
 156
156 -
 157
157 -
 158
158 -
 159
159 -
 160
160 -
 161
161 -
 162
162 -
 163
163 -
 164
164 -
165
-
166
-
167
-
168
-
169
-
170
-
171
-
172
-
173
-
174
-
175
-
176
-
177
-
178
-
179
-
180
-
181
-
182
-
183
-
184
-
185
-
186
-
187
-
188
-
189
-
190
-
191
-
192
-
193
-
194
-
195
-
196
-
197
-
198
-
199
-
200
-
201
-
202
-
203
-
204
-
205
-
206
-
207
-
208
-
209
-
210
-
211
-
212
-
213
-
214
-
215
-
216
-
217
-
218
-
219
-
220
-
221
-
222
-
223
-
224
-
225
-
226
-
227
-
228
-
229
-
230
-
231
-
232
-
233
-
234
-
235
-
236
-
237
-
238
-
239
-
240
-
241
-
242
-
243
-
244
-
245
-
246
-
247
-
248
-
249
-
250
-
251
-
252
-
253
-
254
-
255
-
256
-
257
-
258
-
259
-
260
-
261
-
262
-
263
-
264
-
265
-
266
-
267
-
268
-
269
-
270
-
271
-
272
-
273
-
274
-
275
-
276
-
277
-
278
-
279
-
280
-
281
-
282
-
283
-
284
-
285
-
286
-
287
-
288
-
289
-
290
-
291
-
292
-
293
-
294
-
295
-
296
-
297
-
298
-
299
-
300
-
301
-
302
 |
 |

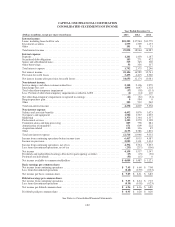
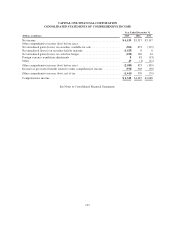
CAPITAL ONE FINANCIAL CORPORATION
CONSOLIDATED BALANCE SHEETS
(Dollars in millions, except per share data)
December 31,
2013
December 31,
2012
Assets:
Cash and cash equivalents:
Cash and due from banks ..................................................... $ 2,821 $ 3,440
Interest-bearing deposits with banks ............................................. 3,131 7,617
Federal funds sold and securities purchased under agreements to resell ................. 339 1
Total cash and cash equivalents .................................................. 6,291 11,058
Restricted cash for securitization investors .......................................... 874 428
Securities available for sale, at fair value ........................................... 41,800 63,979
Securities held to maturity, at carrying value ........................................ 19,132 9
Loans held for investment:
Unsecuritized loans held for investment .......................................... 157,651 162,059
Restricted loans for securitization investors ....................................... 39,548 43,830
Total loans held for investment ................................................... 197,199 205,889
Less: Allowance for loan and lease losses ........................................ (4,315) (5,156)
Net loans held for investment .................................................... 192,884 200,733
Loans held for sale, at lower of cost or fair value ..................................... 218 201
Premises and equipment, net ..................................................... 3,839 3,587
Interest receivable ............................................................. 1,418 1,694
Goodwill .................................................................... 13,978 13,904
Other ....................................................................... 16,614 17,325
Total assets .................................................................. $297,048 $312,918
Liabilities:
Interest payable ............................................................... $ 307 $ 450
Customer deposits:
Non-interest bearing deposits .................................................. 22,643 22,467
Interest bearing deposits ...................................................... 181,880 190,018
Total customer deposits ......................................................... 204,523 212,485
Securitized debt obligations ..................................................... 10,289 11,398
Other debt:
Federal funds purchased and securities loaned or sold under agreements to repurchase ..... 915 1,248
Senior and subordinated notes ................................................. 13,134 12,686
Other borrowings ........................................................... 16,316 24,578
Total other debt ............................................................... 30,365 38,512
Other liabilities ............................................................... 9,820 9,574
Total liabilities ............................................................... 255,304 272,419
Commitments, contingencies and guarantees (see Note 14)
Stockholders’ equity:
Preferred stock, par value $.01 per share; 50,000,000 shares authorized; 875,000 shares issued
and outstanding as of December 31, 2013 and 2012, respectively ...................... 00
Common stock, par value $.01 per share; 1,000,000,000 shares authorized; 637,151,800 and
631,806,585 shares issued as of December 31, 2013 and 2012, respectively, and
572,675,375 and 582,207,133 shares outstanding as of December 31, 2013 and 2012,
respectively ................................................................ 66
Additional paid-in capital, net .................................................... 26,526 26,188
Retained earnings ............................................................. 20,404 16,853
Accumulated other comprehensive income (loss) .................................... (872) 739
Less: Treasury stock, at cost; par value $.01 per share; 64,476,425 and 49,599,452 shares as of
December 31, 2013 and 2012, respectively ....................................... (4,320) (3,287)
Total stockholders’ equity ..................................................... 41,744 40,499
Total liabilities and stockholders’ equity ......................................... $297,048 $312,918
See Notes to Consolidated Financial Statements.
134