Capital One 2013 Annual Report Download - page 292
Download and view the complete annual report
Please find page 292 of the 2013 Capital One annual report below. You can navigate through the pages in the report by either clicking on the pages listed below, or by using the keyword search tool below to find specific information within the annual report.-
 1
1 -
2
-
3
-
4
-
5
-
6
-
7
-
8
-
9
-
10
-
11
-
12
-
13
-
14
-
15
-
16
-
17
-
18
-
19
-
20
-
21
-
22
-
23
-
24
-
25
-
26
-
27
-
28
-
29
-
30
-
31
-
32
-
33
-
34
-
35
-
36
-
37
-
38
-
39
-
40
-
41
-
42
-
43
-
44
-
45
-
46
-
47
-
48
-
49
-
50
-
51
-
52
-
53
-
54
-
55
-
56
-
57
-
58
-
59
-
60
-
61
-
62
-
63
-
64
-
65
-
66
-
67
-
68
-
69
-
70
-
71
-
72
-
73
-
74
-
75
-
76
-
77
-
78
-
79
-
80
-
81
-
82
-
83
-
84
-
85
-
86
-
87
-
88
-
89
-
90
-
91
-
92
-
93
-
94
-
95
-
96
-
97
-
98
-
99
-
100
-
101
-
102
-
103
-
104
-
105
-
106
-
107
-
108
-
109
-
110
-
111
-
112
-
113
-
114
-
115
-
116
-
117
-
118
-
119
-
120
-
121
-
122
-
123
-
124
-
125
-
126
-
127
-
128
-
129
-
130
-
131
-
132
-
133
-
134
-
135
-
136
-
137
-
138
-
139
-
140
-
141
-
142
-
143
-
144
-
145
-
146
-
147
-
148
-
149
-
150
-
151
-
152
-
153
-
154
-
155
-
156
-
157
-
158
-
159
-
160
-
161
-
162
-
163
-
164
-
165
-
166
-
167
-
168
-
169
-
170
-
171
-
172
-
173
-
174
-
175
-
176
-
177
-
178
-
179
-
180
-
181
-
182
-
183
-
184
-
185
-
186
-
187
-
188
-
189
-
190
-
191
-
192
-
193
-
194
-
195
-
196
-
197
-
198
-
199
-
200
-
201
-
202
-
203
-
204
-
205
-
206
-
207
-
208
-
209
-
210
-
211
-
212
-
213
-
214
-
215
-
216
-
217
-
218
-
219
-
220
-
221
-
222
-
223
-
224
-
225
-
226
-
227
-
228
-
229
-
230
-
231
-
232
-
233
-
234
-
235
-
236
-
237
-
238
-
239
-
240
-
241
-
242
-
243
-
244
-
245
-
246
-
247
-
248
-
249
-
250
-
251
-
252
-
253
-
254
-
255
-
256
-
257
-
258
-
259
-
260
-
261
-
262
-
263
-
264
-
265
-
266
-
267
-
268
-
269
-
270
-
271
-
272
-
273
-
274
-
275
-
276
-
277
-
278
-
279
-
280
-
281
-
 282
282 -
 283
283 -
 284
284 -
 285
285 -
 286
286 -
 287
287 -
 288
288 -
 289
289 -
 290
290 -
 291
291 -
 292
292 -
 293
293 -
 294
294 -
 295
295 -
 296
296 -
 297
297 -
 298
298 -
 299
299 -
 300
300 -
 301
301 -
 302
302
 |
 |

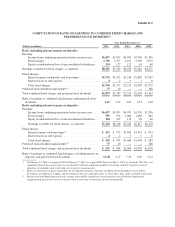
Exhibit 12.1
COMPUTATION OF RATIO OF EARNINGS TO FIXED CHARGES(1)
Year Ended December 31,
(Dollars in millions) 2013 2012 2011 2010 2009
Ratio (including interest expense on deposits):
Earnings:
Income from continuing operations before income taxes .... $6,417 $5,035 $4,587 $4,330 $1,336
Fixed charges ...................................... 1,796 2,377 2,251 2,903 2,975
Equity in undistributed loss of unconsolidated subsidiaries . . 154 127 112 49 60
Earnings available for fixed charges, as adjusted .............. $8,367 $7,539 $6,950 $7,282 $4,371
Fixed charges:
Interest expense on deposits and borrowings .............. $1,792 $2,375 $2,246 $2,896 $2,967
Interest factor in rent expense ......................... 42578
Total fixed charges .................................. $1,796 $2,377 $2,251 $2,903 $2,975
Ratio of earnings to fixed charges .......................... 4.66 3.17 3.09 2.51 1.47
Ratio (excluding interest expense on deposits):
Earnings:
Income from continuing operations before income taxes .... $6,417 $5,035 $4,587 $4,330 $1,336
Fixed charges ...................................... 555 974 1,064 1,438 882
Equity in undistributed loss of unconsolidated subsidiaries . . 154 127 112 49 60
Earnings available for fixed charges, as adjusted .......... $7,126 $6,136 $5,763 $5,817 $2,278
Fixed charges:
Interest expense on borrowings(2) ....................... $ 551 $ 972 $1,059 $1,431 $ 874
Interest factor in rent expense ......................... 42578
Total fixed charges .................................. $ 555 $ 974 $1,064 $1,438 $ 882
Ratio of earnings to fixed charges, excluding interest on
deposits ............................................. 12.84 6.30 5.42 4.05 2.58
(1) On February 27, 2009, we acquired CCB. On February 17, 2012, we acquired ING Direct. On May 1, 2012, we closed the 2012 U.S.
card acquisition. Each of these transactions was accounted for under the acquisition method of accounting, and their respective results
of operations are included in our results from each respective transaction date.
(2) Represents total interest expense reported in our consolidated statements of income, excluding interest on deposits of $1.2 billion,
$1.4 billion, $1.2 billion, $1.5 billion and $2.1 billion for the years ended December 31, 2013, 2012, 2011, 2010, and 2009,
respectively.