Capital One 2013 Annual Report Download - page 137
Download and view the complete annual report
Please find page 137 of the 2013 Capital One annual report below. You can navigate through the pages in the report by either clicking on the pages listed below, or by using the keyword search tool below to find specific information within the annual report.-
 1
1 -
2
-
3
-
4
-
5
-
6
-
7
-
8
-
9
-
10
-
11
-
12
-
13
-
14
-
15
-
16
-
17
-
18
-
19
-
20
-
21
-
22
-
23
-
24
-
25
-
26
-
27
-
28
-
29
-
30
-
31
-
32
-
33
-
34
-
35
-
36
-
37
-
38
-
39
-
40
-
41
-
42
-
43
-
44
-
45
-
46
-
47
-
48
-
49
-
50
-
51
-
52
-
53
-
54
-
55
-
56
-
57
-
58
-
59
-
60
-
61
-
62
-
63
-
64
-
65
-
66
-
67
-
68
-
69
-
70
-
71
-
72
-
73
-
74
-
75
-
76
-
77
-
78
-
79
-
80
-
81
-
82
-
83
-
84
-
85
-
86
-
87
-
88
-
89
-
90
-
91
-
92
-
93
-
94
-
95
-
96
-
97
-
98
-
99
-
100
-
101
-
102
-
103
-
104
-
105
-
106
-
107
-
108
-
109
-
110
-
111
-
112
-
113
-
114
-
115
-
116
-
117
-
118
-
119
-
120
-
121
-
122
-
123
-
124
-
125
-
126
-
 127
127 -
 128
128 -
 129
129 -
 130
130 -
 131
131 -
 132
132 -
 133
133 -
 134
134 -
 135
135 -
 136
136 -
 137
137 -
 138
138 -
 139
139 -
 140
140 -
 141
141 -
 142
142 -
 143
143 -
 144
144 -
 145
145 -
 146
146 -
 147
147 -
148
-
149
-
150
-
151
-
152
-
153
-
154
-
155
-
156
-
157
-
158
-
159
-
160
-
161
-
162
-
163
-
164
-
165
-
166
-
167
-
168
-
169
-
170
-
171
-
172
-
173
-
174
-
175
-
176
-
177
-
178
-
179
-
180
-
181
-
182
-
183
-
184
-
185
-
186
-
187
-
188
-
189
-
190
-
191
-
192
-
193
-
194
-
195
-
196
-
197
-
198
-
199
-
200
-
201
-
202
-
203
-
204
-
205
-
206
-
207
-
208
-
209
-
210
-
211
-
212
-
213
-
214
-
215
-
216
-
217
-
218
-
219
-
220
-
221
-
222
-
223
-
224
-
225
-
226
-
227
-
228
-
229
-
230
-
231
-
232
-
233
-
234
-
235
-
236
-
237
-
238
-
239
-
240
-
241
-
242
-
243
-
244
-
245
-
246
-
247
-
248
-
249
-
250
-
251
-
252
-
253
-
254
-
255
-
256
-
257
-
258
-
259
-
260
-
261
-
262
-
263
-
264
-
265
-
266
-
267
-
268
-
269
-
270
-
271
-
272
-
273
-
274
-
275
-
276
-
277
-
278
-
279
-
280
-
281
-
282
-
283
-
284
-
285
-
286
-
287
-
288
-
289
-
290
-
291
-
292
-
293
-
294
-
295
-
296
-
297
-
298
-
299
-
300
-
301
-
302
 |
 |

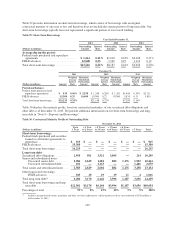
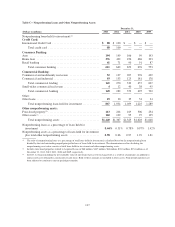
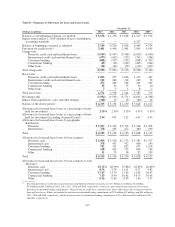
Table C—Nonperforming Loans and Other Nonperforming Assets
December 31,
(Dollars in millions) 2013 2012 2011 2010 2009
Nonperforming loans held for investment:(1)
Credit Card:
International Credit Card ................................. $ 88 $100$ —$ —$ —
Total credit card .................................... 88 100———
Consumer Banking:
Auto ................................................. 194 149 106 99 143
Home loan ............................................ 376 422 456 486 323
Retail banking ......................................... 41 71 90 91 87
Total consumer banking .............................. 611 642 652 676 553
Commercial Banking:
Commercial and multifamily real estate ..................... 52 137 207 276 429
Commercial and industrial ................................ 93 133 125 181 178
Total commercial lending ............................ 145 270 332 457 607
Small-ticket commercial real estate ......................... 412 40 38 95
Total commercial banking ............................ 149 282 372 495 702
Other:
Other loans ............................................ 19 30 35 54 34
Total nonperforming loans held for investment ............ 867 1,054 1,059 1,225 1,289
Other nonperforming assets:
Foreclosed property(2) .................................... 113 204 169 306 234
Other assets(3) .......................................... 160 109 95 97 125
Total nonperforming assets ........................... $1,140 $1,367 $1,323 $1,628 $1,648
Nonperforming loans as a percentage of loans held for
investment .......................................... 0.44% 0.51% 0.78% 0.97% 1.42%
Nonperforming assets as a percentage of loans held for investment
plus total other nonperforming assets ..................... 0.58 0.66 0.97 1.29 1.81
(1) The ratio of nonperforming loans as a percentage of total loans held for investment is calculated based on the nonperforming loans
divided by the total outstanding unpaid principal balance of loans held for investment. The denominator used in calculating the
nonperforming asset ratios consists of total loans held for investment and other nonperforming assets.
(2) Includes foreclosed properties related to Acquired Loans of $68 million, $167 million, $86 million, $201 million, $154 million as of
December 31, 2013, 2012, 2011, 2010 and 2009, respectively.
(3) In 2013, we began including the net realizable value of auto loans that have been charged-off as a result of a bankruptcy in addition to
repossessed assets obtained in satisfaction of auto loans. Both of these amounts are included in other assets. Prior period amounts have
been adjusted to conform to current period presentation.
117