Capital One 2013 Annual Report Download - page 188
Download and view the complete annual report
Please find page 188 of the 2013 Capital One annual report below. You can navigate through the pages in the report by either clicking on the pages listed below, or by using the keyword search tool below to find specific information within the annual report.-
 1
1 -
2
-
3
-
4
-
5
-
6
-
7
-
8
-
9
-
10
-
11
-
12
-
13
-
14
-
15
-
16
-
17
-
18
-
19
-
20
-
21
-
22
-
23
-
24
-
25
-
26
-
27
-
28
-
29
-
30
-
31
-
32
-
33
-
34
-
35
-
36
-
37
-
38
-
39
-
40
-
41
-
42
-
43
-
44
-
45
-
46
-
47
-
48
-
49
-
50
-
51
-
52
-
53
-
54
-
55
-
56
-
57
-
58
-
59
-
60
-
61
-
62
-
63
-
64
-
65
-
66
-
67
-
68
-
69
-
70
-
71
-
72
-
73
-
74
-
75
-
76
-
77
-
78
-
79
-
80
-
81
-
82
-
83
-
84
-
85
-
86
-
87
-
88
-
89
-
90
-
91
-
92
-
93
-
94
-
95
-
96
-
97
-
98
-
99
-
100
-
101
-
102
-
103
-
104
-
105
-
106
-
107
-
108
-
109
-
110
-
111
-
112
-
113
-
114
-
115
-
116
-
117
-
118
-
119
-
120
-
121
-
122
-
123
-
124
-
125
-
126
-
127
-
128
-
129
-
130
-
131
-
132
-
133
-
134
-
135
-
136
-
137
-
138
-
139
-
140
-
141
-
142
-
143
-
144
-
145
-
146
-
147
-
148
-
149
-
150
-
151
-
152
-
153
-
154
-
155
-
156
-
157
-
158
-
159
-
160
-
161
-
162
-
163
-
164
-
165
-
166
-
167
-
168
-
169
-
170
-
171
-
172
-
173
-
174
-
175
-
176
-
177
-
 178
178 -
 179
179 -
 180
180 -
 181
181 -
 182
182 -
 183
183 -
 184
184 -
 185
185 -
 186
186 -
 187
187 -
 188
188 -
 189
189 -
 190
190 -
 191
191 -
 192
192 -
 193
193 -
 194
194 -
 195
195 -
 196
196 -
 197
197 -
 198
198 -
199
-
200
-
201
-
202
-
203
-
204
-
205
-
206
-
207
-
208
-
209
-
210
-
211
-
212
-
213
-
214
-
215
-
216
-
217
-
218
-
219
-
220
-
221
-
222
-
223
-
224
-
225
-
226
-
227
-
228
-
229
-
230
-
231
-
232
-
233
-
234
-
235
-
236
-
237
-
238
-
239
-
240
-
241
-
242
-
243
-
244
-
245
-
246
-
247
-
248
-
249
-
250
-
251
-
252
-
253
-
254
-
255
-
256
-
257
-
258
-
259
-
260
-
261
-
262
-
263
-
264
-
265
-
266
-
267
-
268
-
269
-
270
-
271
-
272
-
273
-
274
-
275
-
276
-
277
-
278
-
279
-
280
-
281
-
282
-
283
-
284
-
285
-
286
-
287
-
288
-
289
-
290
-
291
-
292
-
293
-
294
-
295
-
296
-
297
-
298
-
299
-
300
-
301
-
302
 |
 |

CAPITAL ONE FINANCIAL CORPORATION
NOTES TO CONSOLIDATED FINANCIAL STATEMENTS—(Continued)
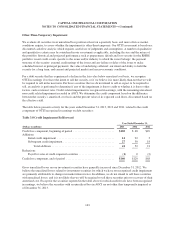
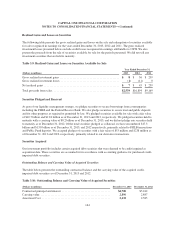
We had total loans held for sale of $218 million and $201 million as of December 31, 2013 and 2012,
respectively.
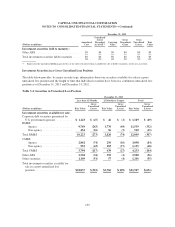
Credit Quality
We closely monitor economic conditions and loan performance trends to manage and evaluate our exposure to
credit risk. Trends in delinquency ratios are an indicator, among other considerations, of credit risk within our
loan portfolios. The level of nonperforming assets represents another indicator of the potential for future credit
losses. Accordingly, key metrics we track and use in evaluating the credit quality of our loan portfolio include
delinquency and nonperforming asset rates, as well as charge-off rates and our internal risk ratings of larger
balance, commercial loans.
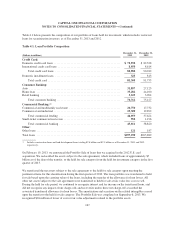
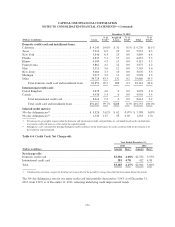
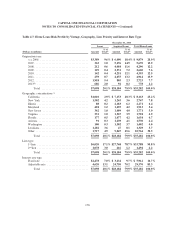
The following table summarizes the payment status of loans in our total loan portfolio, including an aging of
delinquent loans, loans 90 days or more past due that continue to accrue interest and loans classified as
nonperforming. We present the information below on the credit performance of our loan portfolio, by major loan
category, including key metrics that we use in tracking changes in the credit quality of each of our loan
portfolios. The delinquency aging includes all past due loans, both performing and nonperforming, as of
December 31, 2013 and 2012.
Table 4.2: Credit Quality
December 31, 2013
(Dollars in millions) Current
30-59
Days
60-89
Days
> 90
Days
Total
Delinquent
Loans
Acquired
Loans
Total
Loans
> 90 Days
and
Accruing(1)
Nonperforming
Loans(1)
Credit Card:
Domestic credit card .............. $ 70,678 $ 778 $ 549 $1,187 $2,514 $ 63 $ 73,255 $1,187 $ 0
International credit card ........... 7,683 141 85 141 367 0 8,050 96 88
Total credit card ............. 78,361 919 634 1,328 2,881 63 81,305 1,283 88
Consumer Banking:
Auto ........................... 29,477 1,519 662 194 2,375 5 31,857 0 194
Home loan ...................... 6,775 60 24 239 323 28,184 35,282 0 376
Retail banking ................... 3,535 21 8 23 52 36 3,623 2 41
Total consumer banking ....... 39,787 1,600 694 456 2,750 28,225 70,762 2 611
Commercial Banking:
Commercial and multifamily real
estate ........................ 20,602 17 11 36 64 84 20,750 2 52
Commercial and industrial ......... 23,023 69 1 38 108 178 23,309 4 93
Total commercial lending ...... 43,625 86 12 74 172 262 44,059 6 145
Small-ticket commercial real estate . . 941 8 2 1 11 0 952 0 4
Total commercial banking ...... 44,566 94 14 75 183 262 45,011 6 149
Other:
Other loans ..................... 102 4 2 13 19 0 121 0 19
Total .......................... $162,816 $2,617 $1,344 $1,872 $5,833 $28,550 $197,199 $1,291 $867
% of Total loans ................. 82.5% 1.3% 0.8% 0.9% 3.0% 14.5% 100.0% 0.7% 0.4%
168