Capital One 2013 Annual Report Download - page 270
Download and view the complete annual report
Please find page 270 of the 2013 Capital One annual report below. You can navigate through the pages in the report by either clicking on the pages listed below, or by using the keyword search tool below to find specific information within the annual report.-
 1
1 -
2
-
3
-
4
-
5
-
6
-
7
-
8
-
9
-
10
-
11
-
12
-
13
-
14
-
15
-
16
-
17
-
18
-
19
-
20
-
21
-
22
-
23
-
24
-
25
-
26
-
27
-
28
-
29
-
30
-
31
-
32
-
33
-
34
-
35
-
36
-
37
-
38
-
39
-
40
-
41
-
42
-
43
-
44
-
45
-
46
-
47
-
48
-
49
-
50
-
51
-
52
-
53
-
54
-
55
-
56
-
57
-
58
-
59
-
60
-
61
-
62
-
63
-
64
-
65
-
66
-
67
-
68
-
69
-
70
-
71
-
72
-
73
-
74
-
75
-
76
-
77
-
78
-
79
-
80
-
81
-
82
-
83
-
84
-
85
-
86
-
87
-
88
-
89
-
90
-
91
-
92
-
93
-
94
-
95
-
96
-
97
-
98
-
99
-
100
-
101
-
102
-
103
-
104
-
105
-
106
-
107
-
108
-
109
-
110
-
111
-
112
-
113
-
114
-
115
-
116
-
117
-
118
-
119
-
120
-
121
-
122
-
123
-
124
-
125
-
126
-
127
-
128
-
129
-
130
-
131
-
132
-
133
-
134
-
135
-
136
-
137
-
138
-
139
-
140
-
141
-
142
-
143
-
144
-
145
-
146
-
147
-
148
-
149
-
150
-
151
-
152
-
153
-
154
-
155
-
156
-
157
-
158
-
159
-
160
-
161
-
162
-
163
-
164
-
165
-
166
-
167
-
168
-
169
-
170
-
171
-
172
-
173
-
174
-
175
-
176
-
177
-
178
-
179
-
180
-
181
-
182
-
183
-
184
-
185
-
186
-
187
-
188
-
189
-
190
-
191
-
192
-
193
-
194
-
195
-
196
-
197
-
198
-
199
-
200
-
201
-
202
-
203
-
204
-
205
-
206
-
207
-
208
-
209
-
210
-
211
-
212
-
213
-
214
-
215
-
216
-
217
-
218
-
219
-
220
-
221
-
222
-
223
-
224
-
225
-
226
-
227
-
228
-
229
-
230
-
231
-
232
-
233
-
234
-
235
-
236
-
237
-
238
-
239
-
240
-
241
-
242
-
243
-
244
-
245
-
246
-
247
-
248
-
249
-
250
-
251
-
252
-
253
-
254
-
255
-
256
-
257
-
258
-
259
-
 260
260 -
 261
261 -
 262
262 -
 263
263 -
 264
264 -
 265
265 -
 266
266 -
 267
267 -
 268
268 -
 269
269 -
 270
270 -
 271
271 -
 272
272 -
 273
273 -
 274
274 -
 275
275 -
 276
276 -
 277
277 -
 278
278 -
 279
279 -
 280
280 -
281
-
282
-
283
-
284
-
285
-
286
-
287
-
288
-
289
-
290
-
291
-
292
-
293
-
294
-
295
-
296
-
297
-
298
-
299
-
300
-
301
-
302
 |
 |

CAPITAL ONE FINANCIAL CORPORATION
NOTES TO CONSOLIDATED FINANCIAL STATEMENTS—(Continued)
The subsidiaries had open repurchase requests relating to approximately $2.8 billion original principal balance of
mortgage loans as of December 31, 2013, compared with $2.4 billion as of December 31, 2012. Currently,
repurchase demands predominantly relate to the 2006 and 2007 vintages. We have received relatively few
repurchase demands from the 2008 and 2009 vintages, mostly because GreenPoint ceased originating mortgages
in August 2007.
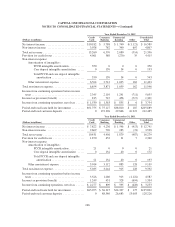
The following table presents information on pending repurchase requests by counterparty category and timing of
initial repurchase request. The amounts presented are based on original loan principal balances.
Table 20.2: Open Pipeline All Vintages (all entities)(1)
(Dollars in millions) (All amounts are Original Principal Balance) GSEs
Insured
Securitizations
Uninsured
Securitizations
and Other Total
Open claims as of December 31, 2011 ...................... $176 $1,243 $ 672 $2,091
Gross new demands received ............................. 189 366 291 846
Loans repurchased/made whole ........................... (233) (3) (138) (374)
Demands rescinded ..................................... (75) (30) (40) (145)
Reclassifications(2) ..................................... 2 3 (4) 1
Open claims as of December 31, 2012 ...................... $ 59 $1,579 $ 781 $2,419
Gross new demands received ............................. 203 40 391 634
Loans repurchased/made whole ........................... (49) (5) (27) (81)
Demands rescinded ..................................... (124) 0 (23) (147)
Open claims as of December 31, 2013 ...................... $ 89 $1,614 $1,122 $2,825
(1) The open pipeline includes all repurchase requests ever received by our subsidiaries where either the requesting party has not formally
rescinded the repurchase request and where our subsidiary has not agreed to either repurchase the loan at issue or make the requesting
party whole with respect to its losses. Accordingly, repurchase requests denied by our subsidiaries and not pursued by the counterparty
remain in the open pipeline, with the exception of certain aged repurchase requests submitted by parties without contractual standing to
pursue such requests, which may be removed from the pipeline. Finally, the amounts reflected in this chart are the original principal
balance amounts of the mortgage loans at issue and do not correspond to the losses our subsidiary would incur upon the repurchase of
these loans.
(2) Represents adjustments to correct the counterparty category as of December 31, 2012 for amounts that were misclassified. The
reclassification had an impact of less than $1 million on the total pending repurchase requests; however, most of the reclassification
resulted from an increase in open claims attributable to GSEs and Insured Securitizations and an offsetting decrease in open claims
attributable to Uninsured Securitizations and Other.
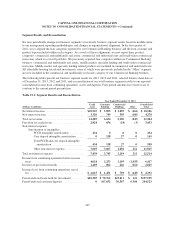
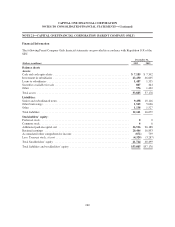
The following table summarizes changes in our representation and warranty reserves for the years ended
December 31, 2013 and 2012:
Table 20.3: Changes in Representation and Warranty Reserves
Year Ended December 31,
(Dollars in millions) 2013 2012
Representation and warranty repurchase reserve, beginning of period(1) .............. $ 899 $ 943
Provision for mortgage representation and warranty losses(2) ...................... 309 349
Net realized losses ........................................................ (36) (393)
Representation and warranty repurchase reserve, end of period(1) ................... $1,172 $ 899
(1) Reported in our consolidated balance sheets as a component of other liabilities.
(2) The pre-tax portion of the provision for mortgage representation and warranty losses recognized in our consolidated statements of
income as a component of non-interest income was a benefit of $24 million and a loss of $42 million in 2013 and 2012, respectively. The
portion of the provision for mortgage representation and warranty recognized in our consolidated statements of income as a component
of discontinued operations totaled $333 million and $307 million in 2013 and 2012, respectively.
250