Capital One 2013 Annual Report Download - page 121
Download and view the complete annual report
Please find page 121 of the 2013 Capital One annual report below. You can navigate through the pages in the report by either clicking on the pages listed below, or by using the keyword search tool below to find specific information within the annual report.-
 1
1 -
2
-
3
-
4
-
5
-
6
-
7
-
8
-
9
-
10
-
11
-
12
-
13
-
14
-
15
-
16
-
17
-
18
-
19
-
20
-
21
-
22
-
23
-
24
-
25
-
26
-
27
-
28
-
29
-
30
-
31
-
32
-
33
-
34
-
35
-
36
-
37
-
38
-
39
-
40
-
41
-
42
-
43
-
44
-
45
-
46
-
47
-
48
-
49
-
50
-
51
-
52
-
53
-
54
-
55
-
56
-
57
-
58
-
59
-
60
-
61
-
62
-
63
-
64
-
65
-
66
-
67
-
68
-
69
-
70
-
71
-
72
-
73
-
74
-
75
-
76
-
77
-
78
-
79
-
80
-
81
-
82
-
83
-
84
-
85
-
86
-
87
-
88
-
89
-
90
-
91
-
92
-
93
-
94
-
95
-
96
-
97
-
98
-
99
-
100
-
101
-
102
-
103
-
104
-
105
-
106
-
107
-
108
-
109
-
110
-
 111
111 -
 112
112 -
 113
113 -
 114
114 -
 115
115 -
 116
116 -
 117
117 -
 118
118 -
 119
119 -
 120
120 -
 121
121 -
 122
122 -
 123
123 -
 124
124 -
 125
125 -
 126
126 -
 127
127 -
 128
128 -
 129
129 -
 130
130 -
 131
131 -
132
-
133
-
134
-
135
-
136
-
137
-
138
-
139
-
140
-
141
-
142
-
143
-
144
-
145
-
146
-
147
-
148
-
149
-
150
-
151
-
152
-
153
-
154
-
155
-
156
-
157
-
158
-
159
-
160
-
161
-
162
-
163
-
164
-
165
-
166
-
167
-
168
-
169
-
170
-
171
-
172
-
173
-
174
-
175
-
176
-
177
-
178
-
179
-
180
-
181
-
182
-
183
-
184
-
185
-
186
-
187
-
188
-
189
-
190
-
191
-
192
-
193
-
194
-
195
-
196
-
197
-
198
-
199
-
200
-
201
-
202
-
203
-
204
-
205
-
206
-
207
-
208
-
209
-
210
-
211
-
212
-
213
-
214
-
215
-
216
-
217
-
218
-
219
-
220
-
221
-
222
-
223
-
224
-
225
-
226
-
227
-
228
-
229
-
230
-
231
-
232
-
233
-
234
-
235
-
236
-
237
-
238
-
239
-
240
-
241
-
242
-
243
-
244
-
245
-
246
-
247
-
248
-
249
-
250
-
251
-
252
-
253
-
254
-
255
-
256
-
257
-
258
-
259
-
260
-
261
-
262
-
263
-
264
-
265
-
266
-
267
-
268
-
269
-
270
-
271
-
272
-
273
-
274
-
275
-
276
-
277
-
278
-
279
-
280
-
281
-
282
-
283
-
284
-
285
-
286
-
287
-
288
-
289
-
290
-
291
-
292
-
293
-
294
-
295
-
296
-
297
-
298
-
299
-
300
-
301
-
302
 |
 |

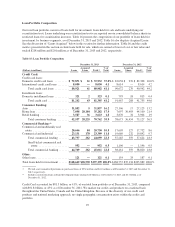
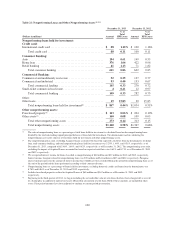
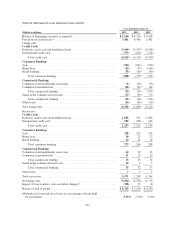
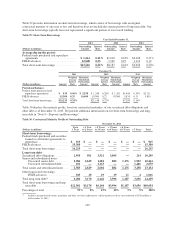
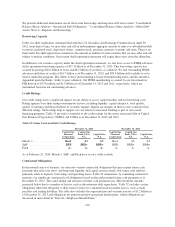
Net Charge-Offs
Net charge-offs consist of the unpaid principal balance of loans held for investment that we determine are
uncollectible, net of recovered amounts. We exclude accrued and unpaid finance charges and fees and fraud
losses from charge-offs. Charge-offs are recorded as a reduction to the allowance for loan and lease losses and
subsequent recoveries of previously charged off amounts are credited to the allowance for loan and lease losses.
Costs incurred to recover charged-off loans are recorded as collection expense and included in our consolidated
statements of income as a component of other non-interest expense. Our charge-off time frame for loans varies
based on the loan type. See “Note 1—Summary of Significant Accounting Policies—Loans” for information on
our charge-off policy for each of our loan categories.
Table 22 presents our net charge-off amounts and rates, by business segment, in 2013, 2012 and 2011.
Table 22: Net Charge-Offs
(Dollars in millions)
Year Ended December 31,
2013 2012 2011
Amount Rate(1)
Adjusted
Rate(2) Amount Rate(1)
Adjusted
Rate(2) Amount Rate(1)
Adjusted
Rate(2)
Credit Card:
Domestic credit card and
installment loans .......... $ 2,904 4.08% 4.08%$ 2,532 3.53% 3.54% $ 2,522 4.72% 4.72%
International credit card ...... 381 4.78 4.78 412 4.98 4.98 534 6.18 6.18
Total credit card ............ 3,285 4.15 4.15 2,944 3.68 3.69 3,056 4.92 4.92
Consumer Banking:
Auto ..................... 546 1.85 1.85 414 1.66 1.66 334 1.72 1.72
Home loan ................ 16 0.04 0.21 52 0.12 0.68 77 0.68 1.11
Retail banking .............. 54 1.46 1.47 65 1.57 1.59 73 1.78 1.81
Total consumer banking ...... 616 0.85 1.51 531 0.74 1.45 484 1.39 1.59
Commercial Banking:
Commercial and multifamily
real estate ............... (8) (0.04) (0.04) 5 0.03 0.03 65 0.46 0.47
Commercial and industrial .... 15 0.07 0.07 8 0.04 0.04 41 0.27 0.27
Total commercial lending ..... 7 0.02 0.02 13 0.04 0.04 106 0.36 0.37
Small-ticket commercial real
estate ................... 7 0.62 0.62 29 2.19 2.19 71 4.30 4.30
Total commercial banking .... 14 0.03 0.03 42 0.12 0.12 177 0.57 0.58
Other:
Other loans ................ 19 11.34 13.96 38 24.14 24.57 54 25.96 25.96
Total ..................... $ 3,934 2.04% 2.45%$ 3,555 1.89% 2.34% $ 3,771 2.94% 3.06%
Average loans held for
investment .............. $192,614 $187,915 $128,424
Average loans held for
investment (excluding
Acquired Loans) .......... 160,459 151,668 123,416
(1) Calculated for each loan category by dividing net charge-offs for the period by average loans held for investment during the period.
(2) Calculated by excluding Acquired Loans from the denominator.
101