Capital One 2013 Annual Report Download - page 233
Download and view the complete annual report
Please find page 233 of the 2013 Capital One annual report below. You can navigate through the pages in the report by either clicking on the pages listed below, or by using the keyword search tool below to find specific information within the annual report.-
 1
1 -
2
-
3
-
4
-
5
-
6
-
7
-
8
-
9
-
10
-
11
-
12
-
13
-
14
-
15
-
16
-
17
-
18
-
19
-
20
-
21
-
22
-
23
-
24
-
25
-
26
-
27
-
28
-
29
-
30
-
31
-
32
-
33
-
34
-
35
-
36
-
37
-
38
-
39
-
40
-
41
-
42
-
43
-
44
-
45
-
46
-
47
-
48
-
49
-
50
-
51
-
52
-
53
-
54
-
55
-
56
-
57
-
58
-
59
-
60
-
61
-
62
-
63
-
64
-
65
-
66
-
67
-
68
-
69
-
70
-
71
-
72
-
73
-
74
-
75
-
76
-
77
-
78
-
79
-
80
-
81
-
82
-
83
-
84
-
85
-
86
-
87
-
88
-
89
-
90
-
91
-
92
-
93
-
94
-
95
-
96
-
97
-
98
-
99
-
100
-
101
-
102
-
103
-
104
-
105
-
106
-
107
-
108
-
109
-
110
-
111
-
112
-
113
-
114
-
115
-
116
-
117
-
118
-
119
-
120
-
121
-
122
-
123
-
124
-
125
-
126
-
127
-
128
-
129
-
130
-
131
-
132
-
133
-
134
-
135
-
136
-
137
-
138
-
139
-
140
-
141
-
142
-
143
-
144
-
145
-
146
-
147
-
148
-
149
-
150
-
151
-
152
-
153
-
154
-
155
-
156
-
157
-
158
-
159
-
160
-
161
-
162
-
163
-
164
-
165
-
166
-
167
-
168
-
169
-
170
-
171
-
172
-
173
-
174
-
175
-
176
-
177
-
178
-
179
-
180
-
181
-
182
-
183
-
184
-
185
-
186
-
187
-
188
-
189
-
190
-
191
-
192
-
193
-
194
-
195
-
196
-
197
-
198
-
199
-
200
-
201
-
202
-
203
-
204
-
205
-
206
-
207
-
208
-
209
-
210
-
211
-
212
-
213
-
214
-
215
-
216
-
217
-
218
-
219
-
220
-
221
-
222
-
 223
223 -
 224
224 -
 225
225 -
 226
226 -
 227
227 -
 228
228 -
 229
229 -
 230
230 -
 231
231 -
 232
232 -
 233
233 -
 234
234 -
 235
235 -
 236
236 -
 237
237 -
 238
238 -
 239
239 -
 240
240 -
 241
241 -
 242
242 -
 243
243 -
244
-
245
-
246
-
247
-
248
-
249
-
250
-
251
-
252
-
253
-
254
-
255
-
256
-
257
-
258
-
259
-
260
-
261
-
262
-
263
-
264
-
265
-
266
-
267
-
268
-
269
-
270
-
271
-
272
-
273
-
274
-
275
-
276
-
277
-
278
-
279
-
280
-
281
-
282
-
283
-
284
-
285
-
286
-
287
-
288
-
289
-
290
-
291
-
292
-
293
-
294
-
295
-
296
-
297
-
298
-
299
-
300
-
301
-
302
 |
 |

CAPITAL ONE FINANCIAL CORPORATION
NOTES TO CONSOLIDATED FINANCIAL STATEMENTS—(Continued)
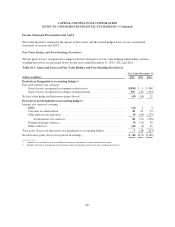
We also disclose a Tier 1 common ratio for our bank holding company. There is currently no mandated minimum
or “well capitalized” standard for Tier 1 common; instead the risk-based capital rules state that voting common
stockholders’ equity should be the dominant element within Tier 1 common capital. While this regulatory capital
measure is widely used by investors, analysts and bank regulatory agencies to assess the capital position of
financial services companies, it may not be comparable to similarly titled measures reported by other companies.
We are also subject to minimum cash reserve requirements by the Federal Reserve totaling approximately $1.5
billion as of December 31, 2013.
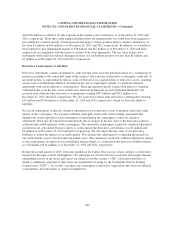
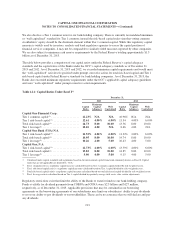
The table below provides a comparison of our capital ratios under the Federal Reserve’s capital adequacy
standards and the capital ratios of the Banks under the OCC’s capital adequacy standards as of December 31,
2013 and 2012. As of December 31, 2013 and 2012, we exceeded minimum capital requirements and would meet
the “well-capitalized” ratio levels specified under prompt corrective action for total risk-based capital and Tier 1
risk-based capital under Federal Reserve standards for bank holding companies. As of December 31, 2013, the
Banks also exceeded minimum regulatory requirements under the OCC’s applicable capital adequacy guidelines
and were “well-capitalized” under prompt corrective action requirements.
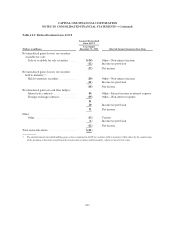
Table 12.1: Capital Ratios Under Basel I(1)
December 31,
2013 2012
Capital
Ratio
Minimum
Capital
Adequacy
Well
Capitalized
Capital
Ratio
Minimum
Capital
Adequacy
Well
Capitalized
Capital One Financial Corp:
Tier 1 common capital(2) .................... 12.23% N/A N/A 10.96% N/A N/A
Tier 1 risk-based capital(3) .................. 12.61 4.00% 6.00% 11.34 4.00% 6.00%
Total risk-based capital(4) ................... 14.73 8.00 10.00 13.56 8.00 10.00
Tier 1 leverage(5) .......................... 10.10 4.00 N/A 8.66 4.00 N/A
Capital One Bank (USA) N.A.
Tier 1 risk-based capital(3) .................. 11.52% 4.00% 6.00% 11.32% 4.00% 6.00%
Total risk-based capital(4) ................... 14.95 8.00 10.00 14.74 8.00 10.00
Tier 1 leverage(5) .......................... 10.26 4.00 5.00 10.43 4.00 5.00
Capital One, N.A.
Tier 1 risk-based capital(3) .................. 12.73% 4.00% 6.00% 13.59% 4.00% 6.00%
Total risk-based capital(4) ................... 13.82 8.00 10.00 14.85 8.00 10.00
Tier 1 leverage(5) .......................... 9.00 4.00 5.00 9.15 4.00 5.00
(1) Calculated under capital standards and regulations based on the international capital framework commonly known as Basel I. Capital
ratios that are not applicable are denoted by “N/A.”
(2) Tier 1 common ratio is a regulatory capital measure calculated based on Tier 1 common capital divided by risk-weighted assets.
(3) Tier 1 risk-based capital ratio is a regulatory capital measure calculated based on Tier 1 capital divided by risk-weighted assets.
(4) Total risk-based capital ratio is a regulatory capital measure calculated based on total risk-based capital divided by risk-weighted assets.
(5) Tier 1 leverage ratio is calculated based on Tier 1 capital divided by quarterly average total assets, after certain adjustments.
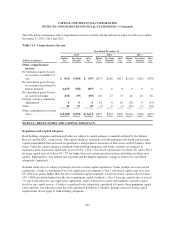
Regulatory restrictions exist that limit the ability of the Banks to transfer funds to our bank holding company.
Funds available for dividend payments from COBNA and CONA were $2.3 billion and $127 million,
respectively, as of December 31, 2013. Applicable provisions that may be contained in our borrowing
agreements or the borrowing agreements of our subsidiaries may limit our subsidiaries’ ability to pay dividends
to us or our ability to pay dividends to our stockholders. There can be no assurance that we will declare and pay
any dividends.
213