Capital One 2013 Annual Report Download - page 87
Download and view the complete annual report
Please find page 87 of the 2013 Capital One annual report below. You can navigate through the pages in the report by either clicking on the pages listed below, or by using the keyword search tool below to find specific information within the annual report.-
 1
1 -
2
-
3
-
4
-
5
-
6
-
7
-
8
-
9
-
10
-
11
-
12
-
13
-
14
-
15
-
16
-
17
-
18
-
19
-
20
-
21
-
22
-
23
-
24
-
25
-
26
-
27
-
28
-
29
-
30
-
31
-
32
-
33
-
34
-
35
-
36
-
37
-
38
-
39
-
40
-
41
-
42
-
43
-
44
-
45
-
46
-
47
-
48
-
49
-
50
-
51
-
52
-
53
-
54
-
55
-
56
-
57
-
58
-
59
-
60
-
61
-
62
-
63
-
64
-
65
-
66
-
67
-
68
-
69
-
70
-
71
-
72
-
73
-
74
-
75
-
76
-
 77
77 -
 78
78 -
 79
79 -
 80
80 -
 81
81 -
 82
82 -
 83
83 -
 84
84 -
 85
85 -
 86
86 -
 87
87 -
 88
88 -
 89
89 -
 90
90 -
 91
91 -
 92
92 -
 93
93 -
 94
94 -
 95
95 -
 96
96 -
 97
97 -
98
-
99
-
100
-
101
-
102
-
103
-
104
-
105
-
106
-
107
-
108
-
109
-
110
-
111
-
112
-
113
-
114
-
115
-
116
-
117
-
118
-
119
-
120
-
121
-
122
-
123
-
124
-
125
-
126
-
127
-
128
-
129
-
130
-
131
-
132
-
133
-
134
-
135
-
136
-
137
-
138
-
139
-
140
-
141
-
142
-
143
-
144
-
145
-
146
-
147
-
148
-
149
-
150
-
151
-
152
-
153
-
154
-
155
-
156
-
157
-
158
-
159
-
160
-
161
-
162
-
163
-
164
-
165
-
166
-
167
-
168
-
169
-
170
-
171
-
172
-
173
-
174
-
175
-
176
-
177
-
178
-
179
-
180
-
181
-
182
-
183
-
184
-
185
-
186
-
187
-
188
-
189
-
190
-
191
-
192
-
193
-
194
-
195
-
196
-
197
-
198
-
199
-
200
-
201
-
202
-
203
-
204
-
205
-
206
-
207
-
208
-
209
-
210
-
211
-
212
-
213
-
214
-
215
-
216
-
217
-
218
-
219
-
220
-
221
-
222
-
223
-
224
-
225
-
226
-
227
-
228
-
229
-
230
-
231
-
232
-
233
-
234
-
235
-
236
-
237
-
238
-
239
-
240
-
241
-
242
-
243
-
244
-
245
-
246
-
247
-
248
-
249
-
250
-
251
-
252
-
253
-
254
-
255
-
256
-
257
-
258
-
259
-
260
-
261
-
262
-
263
-
264
-
265
-
266
-
267
-
268
-
269
-
270
-
271
-
272
-
273
-
274
-
275
-
276
-
277
-
278
-
279
-
280
-
281
-
282
-
283
-
284
-
285
-
286
-
287
-
288
-
289
-
290
-
291
-
292
-
293
-
294
-
295
-
296
-
297
-
298
-
299
-
300
-
301
-
302
 |
 |
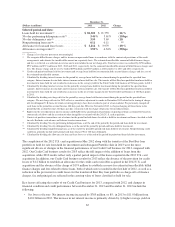
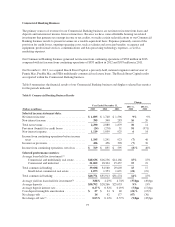
•Provision for Credit Losses: The provision for credit losses related to our Credit Card business increased to
$4.1 billion in 2012, from $1.9 billion in 2011. The significant increase in the provision in 2012 was
primarily driven by the provision of $1.2 billion recorded in the second quarter of 2012 to establish an
allowance for the receivables acquired in the 2012 U.S. card acquisition with revolving privileges. We
recorded an additional provision for credit losses for these loans of $107 million in the second half of 2012.
The provision for credit losses, excluding the allowance build related to the receivables acquired in the 2012
U.S. card acquisition, totaled $2.8 billion in 2012, reflecting a relative stabilization in credit performance
improvement compared to significant credit performance improvement in 2011 that resulted in a large
allowance release of $1.2 billion in 2011.
•Non-Interest Expense: Non-interest expense increased by $1.8 billion, or 36%, in 2012. The increase was
largely due to higher operating expenses resulting from the 2012 U.S. card acquisition and the amortization
of intangibles and other assets associated with the 2012 U.S. card acquisition, including PCCR intangible
amortization expense of $350 million in 2012. Other items contributing to the increase in non-interest
expense include merger-related expenses associated with the 2012 U.S. card acquisition, expense of
$75 million recognized in the first quarter of 2012 for expected customer refunds attributable to issues
associated with cross-selling certain other products to credit card customers, regulatory fines of $60 million
related to cross-sell activities in the Domestic Card business and expense of $98 million for net litigation
reserves to cover interchange and other legal matters in the second quarter of 2012.
•Total Loans: Period-end loans in our Credit Card business increased by $26.7 billion, or 41%, in 2012, to
$91.8 billion as of December 31, 2012. The increase was primarily due to the addition of the $27.8 billion in
outstanding receivables acquired in the 2012 U.S. card acquisition classified as held for investment.
Excluding the addition of these receivables, period-end loans held for investment decreased by $1.1 billion,
or 2%, due to the expected continued run-off of our installment loan portfolio as well as the expected run-
off of higher-margin, higher-loss receivables acquired in the 2012 U.S. card acquisition.
•Charge-off and Delinquency Statistics: Our reported net charge-off rate decreased to 3.68% in 2012, from
4.92% in 2011. Our reported charge-offs reflect the absence of charge-offs for the receivables acquired in
the 2012 U.S. card acquisition accounted for based on estimated cash flows expected to be collected over
the life of the loans. Charges offs are recorded on Acquired Loans when the nonaccretable difference on the
loans are reduced to zero. The decrease in the net-charge off rates was also due in part to the addition of
loans acquired in the 2012 U.S. card acquisition to the denominator in calculating our reported charge-off
rates. The 30+ day delinquency rate decreased to 3.69% as of December 31, 2012, from 3.86% as of
December 31, 2011.
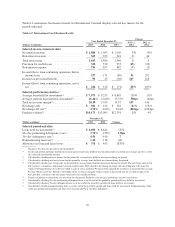
Domestic Card Business
Domestic Card generated net income from continuing operations of $2.4 billion in 2013, compared with net
income from continuing operations of $1.4 billion in 2012 and $2.3 billion in 2011. Domestic Card accounted for
90% of total revenues for our Credit Card business in 2013 compared with 89% in 2012 and 87% in 2011.
Income attributable to Domestic Card represented 91% of income for our Credit Card business in 2013,
compared with 92% in 2012 and 102% in 2011.
67