Capital One 2013 Annual Report Download - page 129
Download and view the complete annual report
Please find page 129 of the 2013 Capital One annual report below. You can navigate through the pages in the report by either clicking on the pages listed below, or by using the keyword search tool below to find specific information within the annual report.-
 1
1 -
2
-
3
-
4
-
5
-
6
-
7
-
8
-
9
-
10
-
11
-
12
-
13
-
14
-
15
-
16
-
17
-
18
-
19
-
20
-
21
-
22
-
23
-
24
-
25
-
26
-
27
-
28
-
29
-
30
-
31
-
32
-
33
-
34
-
35
-
36
-
37
-
38
-
39
-
40
-
41
-
42
-
43
-
44
-
45
-
46
-
47
-
48
-
49
-
50
-
51
-
52
-
53
-
54
-
55
-
56
-
57
-
58
-
59
-
60
-
61
-
62
-
63
-
64
-
65
-
66
-
67
-
68
-
69
-
70
-
71
-
72
-
73
-
74
-
75
-
76
-
77
-
78
-
79
-
80
-
81
-
82
-
83
-
84
-
85
-
86
-
87
-
88
-
89
-
90
-
91
-
92
-
93
-
94
-
95
-
96
-
97
-
98
-
99
-
100
-
101
-
102
-
103
-
104
-
105
-
106
-
107
-
108
-
109
-
110
-
111
-
112
-
113
-
114
-
115
-
116
-
117
-
118
-
 119
119 -
 120
120 -
 121
121 -
 122
122 -
 123
123 -
 124
124 -
 125
125 -
 126
126 -
 127
127 -
 128
128 -
 129
129 -
 130
130 -
 131
131 -
 132
132 -
 133
133 -
 134
134 -
 135
135 -
 136
136 -
 137
137 -
 138
138 -
 139
139 -
140
-
141
-
142
-
143
-
144
-
145
-
146
-
147
-
148
-
149
-
150
-
151
-
152
-
153
-
154
-
155
-
156
-
157
-
158
-
159
-
160
-
161
-
162
-
163
-
164
-
165
-
166
-
167
-
168
-
169
-
170
-
171
-
172
-
173
-
174
-
175
-
176
-
177
-
178
-
179
-
180
-
181
-
182
-
183
-
184
-
185
-
186
-
187
-
188
-
189
-
190
-
191
-
192
-
193
-
194
-
195
-
196
-
197
-
198
-
199
-
200
-
201
-
202
-
203
-
204
-
205
-
206
-
207
-
208
-
209
-
210
-
211
-
212
-
213
-
214
-
215
-
216
-
217
-
218
-
219
-
220
-
221
-
222
-
223
-
224
-
225
-
226
-
227
-
228
-
229
-
230
-
231
-
232
-
233
-
234
-
235
-
236
-
237
-
238
-
239
-
240
-
241
-
242
-
243
-
244
-
245
-
246
-
247
-
248
-
249
-
250
-
251
-
252
-
253
-
254
-
255
-
256
-
257
-
258
-
259
-
260
-
261
-
262
-
263
-
264
-
265
-
266
-
267
-
268
-
269
-
270
-
271
-
272
-
273
-
274
-
275
-
276
-
277
-
278
-
279
-
280
-
281
-
282
-
283
-
284
-
285
-
286
-
287
-
288
-
289
-
290
-
291
-
292
-
293
-
294
-
295
-
296
-
297
-
298
-
299
-
300
-
301
-
302
 |
 |

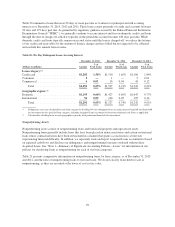
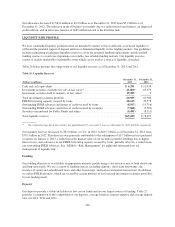
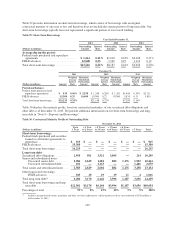
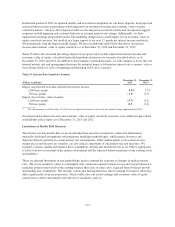
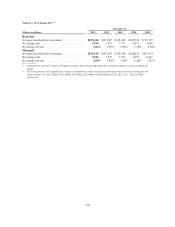
Table 29 provides information on short-term borrowings, which consist of borrowings with an original
contractual maturity of one year or less and therefore does not include the current portion of long-term debt. Our
short-term borrowings typically have not represented a significant portion of our overall funding.
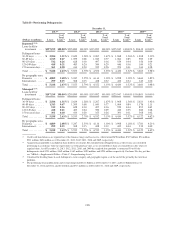
Table 29: Short-Term Borrowings
Year Ended December 31,
2013 2012 2011
(Dollars in millions)
Outstanding
Amount
Interest
Rate
Outstanding
Amount
Interest
Rate
Outstanding
Amount
Interest
Rate
Average during the period:
Federal funds purchased and repurchase
agreements .......................... $ 1,614 0.11% $1,018 0.18% $2,186 0.21%
FHLB advances ........................ 12,048 0.23 7,169 0.25 1,110 0.19
Total short-term borrowings .............. $13,662 0.22% $8,187 0.24% $3,296 0.20%
December 31,
2013 2012 2011
(Dollars in millions) Amount
Weighted
Average
Interest
Rate
Maximum
Month-End
Outstanding
Amount Amount
Weighted
Average
Interest
Rate
Maximum
Month-End
Outstanding
Amount Amount
Weighted
Average
Interest
Rate
Maximum
Month-End
Outstanding
Amount
Period-end balance:
Federal funds purchased and
repurchase agreements ..... $ 915 0.06% $ 2,258 $ 1,248 0.28% $ 1,381 $1,464 0.30% $2,111
FHLB advances ............. 15,300 0.25 16,600 19,900 0.27 19,900 5,835 0.13 5,835
Total short-term borrowings . . . $16,215 0.24% $21,148 0.27% $7,299 0.16%
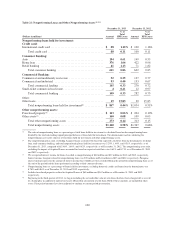
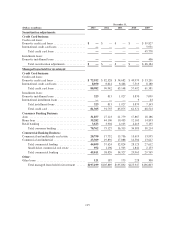
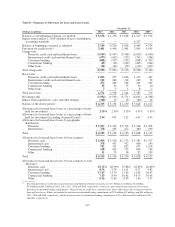
Table 30 displays the maturity profile, based on contractual maturities, of our securitized debt obligations and
other debt as of December 31, 2013. We provide additional information on our short-term borrowings and long-
term debt in “Note 9—Deposits and Borrowings.”
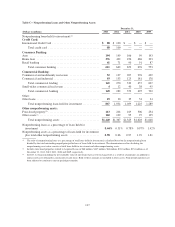
Table 30: Contractual Maturity Profile of Outstanding Debt
December 31, 2013
(Dollars in millions)
Up to
1 Year
> 1 Year
to 2 Years
> 2 Years
to 3 Years
> 3 Years
to 4 Years
> 4 Years
to 5 Years > 5 Years Total
Short-term borrowings:
Federal funds purchased and securities
loaned or sold under agreements to
repurchase ..................... $915$— $— $— $— $—$915
FHLB advances ................... 15,300 —————15,300
Total short-term borrowings ......... 16,215 —————16,215
Long-term debt:
Securitized debt obligations ......... 2,958 501 3,521 3,095 — 214 10,289
Senior and subordinated notes:
Unsecured senior debt .......... 2,284 2,649 1,481 882 1,176 1,992 10,464
Unsecured subordinated debt .... 101 — 1,123 — — 1,446 2,670
Total senior and subordinated notes . . . 2,385 2,649 2,604 882 1,176 3,438 13,134
Other long-term borrowings:
FHLB advances ............... 943 20 19 19 11 4 1,016
Total long-term debt(1) ............. 6,286 3,170 6,144 3,996 1,187 3,656 24,439
Total short-term borrowings and long-
term debt ...................... $22,501 $3,170 $6,144 $3,996 $1,187 $3,656 $40,654
Percentage of total ................ 55% 8% 15% 10% 3% 9% 100%
(1) Includes unamortized discounts, premiums and other cost basis adjustments, which together result in a net reduction of $236 million as
of December 31, 2013.
109