Capital One 2013 Annual Report Download - page 5
Download and view the complete annual report
Please find page 5 of the 2013 Capital One annual report below. You can navigate through the pages in the report by either clicking on the pages listed below, or by using the keyword search tool below to find specific information within the annual report.-
 1
1 -
 2
2 -
 3
3 -
 4
4 -
 5
5 -
 6
6 -
 7
7 -
 8
8 -
 9
9 -
 10
10 -
 11
11 -
 12
12 -
 13
13 -
 14
14 -
 15
15 -
 16
16 -
17
-
18
-
19
-
20
-
21
-
22
-
23
-
24
-
25
-
26
-
27
-
28
-
29
-
30
-
31
-
32
-
33
-
34
-
35
-
36
-
37
-
38
-
39
-
40
-
41
-
42
-
43
-
44
-
45
-
46
-
47
-
48
-
49
-
50
-
51
-
52
-
53
-
54
-
55
-
56
-
57
-
58
-
59
-
60
-
61
-
62
-
63
-
64
-
65
-
66
-
67
-
68
-
69
-
70
-
71
-
72
-
73
-
74
-
75
-
76
-
77
-
78
-
79
-
80
-
81
-
82
-
83
-
84
-
85
-
86
-
87
-
88
-
89
-
90
-
91
-
92
-
93
-
94
-
95
-
96
-
97
-
98
-
99
-
100
-
101
-
102
-
103
-
104
-
105
-
106
-
107
-
108
-
109
-
110
-
111
-
112
-
113
-
114
-
115
-
116
-
117
-
118
-
119
-
120
-
121
-
122
-
123
-
124
-
125
-
126
-
127
-
128
-
129
-
130
-
131
-
132
-
133
-
134
-
135
-
136
-
137
-
138
-
139
-
140
-
141
-
142
-
143
-
144
-
145
-
146
-
147
-
148
-
149
-
150
-
151
-
152
-
153
-
154
-
155
-
156
-
157
-
158
-
159
-
160
-
161
-
162
-
163
-
164
-
165
-
166
-
167
-
168
-
169
-
170
-
171
-
172
-
173
-
174
-
175
-
176
-
177
-
178
-
179
-
180
-
181
-
182
-
183
-
184
-
185
-
186
-
187
-
188
-
189
-
190
-
191
-
192
-
193
-
194
-
195
-
196
-
197
-
198
-
199
-
200
-
201
-
202
-
203
-
204
-
205
-
206
-
207
-
208
-
209
-
210
-
211
-
212
-
213
-
214
-
215
-
216
-
217
-
218
-
219
-
220
-
221
-
222
-
223
-
224
-
225
-
226
-
227
-
228
-
229
-
230
-
231
-
232
-
233
-
234
-
235
-
236
-
237
-
238
-
239
-
240
-
241
-
242
-
243
-
244
-
245
-
246
-
247
-
248
-
249
-
250
-
251
-
252
-
253
-
254
-
255
-
256
-
257
-
258
-
259
-
260
-
261
-
262
-
263
-
264
-
265
-
266
-
267
-
268
-
269
-
270
-
271
-
272
-
273
-
274
-
275
-
276
-
277
-
278
-
279
-
280
-
281
-
282
-
283
-
284
-
285
-
286
-
287
-
288
-
289
-
290
-
291
-
292
-
293
-
294
-
295
-
296
-
297
-
298
-
299
-
300
-
301
-
302
 |
 |

Strong Performance
in a Challenging Environment
In 2013, Capital One and other banks faced ongoing challenges from
a fragile economic recovery, relatively weak customer demand, and
persistently low interest rates. Our financial results also reflected choices
we have made to focus on resilience. These choices include letting
the least resilient parts of acquired loan portfolios run-off, avoiding
high-balance revolvers in our card business, and ending our partnership
with Best Buy®.
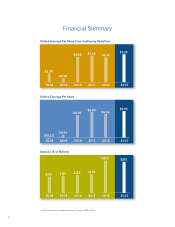
Despite these pressures, we delivered operating earnings of $4.39
billion in 2013, up from $3.73 billion in 2012. Earnings per share also
grew, rising to $6.96 from $6.16 for 2012. Revenue growth and lower
provision expense drove the improvement in earnings. Return on
tangible common equity remained at the higher end of the banking
industry’s returns.
At the beginning of 2013, we set expectations for annual revenue of about
$22.5 billion, non-interest expense of about $12.5 billion, and pre-provision
earnings of about $10 billion, excluding non-recurring items. We delivered
revenue of $22.38 billion, non-interest expense of $12.51 billion, and
pre-provision earnings of $9.87 billion. Excluding non-recurring items, actual
2013 pre-provision earnings were $9.97 billion.
Credit performance remained strong and relatively stable. The charge-off rate
was 2.04%, up modestly from 1.89% in 2012. Provision expense improved
to $3.45 billion in 2013 from $4.42 billion in 2012. The improvement
resulted from allowance releases in 2013 as opposed to an allowance
build in 2012 in the wake of our acquisitions.
The Tier 1 common ratio under Basel I capital rules was 12.23% at the end
of 2013, up from 10.96%, which puts us at the higher end of the range for
peer banks. The equivalent Tier 1 common ratio under the fully phased-in
Basel III Advanced Approaches framework is above our assumed long-term
target of 8%, years before those requirements take effect. Our strong
capital levels and capital accretion trajectory enabled us to increase our
quarterly dividend from five to thirty cents per share beginning in the
second quarter of 2013. We also completed share repurchases of about
$1 billion during the year.
“Together with the
great people of
Capital One, I look
forward to continuing
our quest to bring
ingenuity, simplicity,
and humanity to
banking, and along
the way build
one of America’s
great companies.”
3