Capital One 2013 Annual Report Download - page 245
Download and view the complete annual report
Please find page 245 of the 2013 Capital One annual report below. You can navigate through the pages in the report by either clicking on the pages listed below, or by using the keyword search tool below to find specific information within the annual report.-
 1
1 -
2
-
3
-
4
-
5
-
6
-
7
-
8
-
9
-
10
-
11
-
12
-
13
-
14
-
15
-
16
-
17
-
18
-
19
-
20
-
21
-
22
-
23
-
24
-
25
-
26
-
27
-
28
-
29
-
30
-
31
-
32
-
33
-
34
-
35
-
36
-
37
-
38
-
39
-
40
-
41
-
42
-
43
-
44
-
45
-
46
-
47
-
48
-
49
-
50
-
51
-
52
-
53
-
54
-
55
-
56
-
57
-
58
-
59
-
60
-
61
-
62
-
63
-
64
-
65
-
66
-
67
-
68
-
69
-
70
-
71
-
72
-
73
-
74
-
75
-
76
-
77
-
78
-
79
-
80
-
81
-
82
-
83
-
84
-
85
-
86
-
87
-
88
-
89
-
90
-
91
-
92
-
93
-
94
-
95
-
96
-
97
-
98
-
99
-
100
-
101
-
102
-
103
-
104
-
105
-
106
-
107
-
108
-
109
-
110
-
111
-
112
-
113
-
114
-
115
-
116
-
117
-
118
-
119
-
120
-
121
-
122
-
123
-
124
-
125
-
126
-
127
-
128
-
129
-
130
-
131
-
132
-
133
-
134
-
135
-
136
-
137
-
138
-
139
-
140
-
141
-
142
-
143
-
144
-
145
-
146
-
147
-
148
-
149
-
150
-
151
-
152
-
153
-
154
-
155
-
156
-
157
-
158
-
159
-
160
-
161
-
162
-
163
-
164
-
165
-
166
-
167
-
168
-
169
-
170
-
171
-
172
-
173
-
174
-
175
-
176
-
177
-
178
-
179
-
180
-
181
-
182
-
183
-
184
-
185
-
186
-
187
-
188
-
189
-
190
-
191
-
192
-
193
-
194
-
195
-
196
-
197
-
198
-
199
-
200
-
201
-
202
-
203
-
204
-
205
-
206
-
207
-
208
-
209
-
210
-
211
-
212
-
213
-
214
-
215
-
216
-
217
-
218
-
219
-
220
-
221
-
222
-
223
-
224
-
225
-
226
-
227
-
228
-
229
-
230
-
231
-
232
-
233
-
234
-
 235
235 -
 236
236 -
 237
237 -
 238
238 -
 239
239 -
 240
240 -
 241
241 -
 242
242 -
 243
243 -
 244
244 -
 245
245 -
 246
246 -
 247
247 -
 248
248 -
 249
249 -
 250
250 -
 251
251 -
 252
252 -
 253
253 -
 254
254 -
 255
255 -
256
-
257
-
258
-
259
-
260
-
261
-
262
-
263
-
264
-
265
-
266
-
267
-
268
-
269
-
270
-
271
-
272
-
273
-
274
-
275
-
276
-
277
-
278
-
279
-
280
-
281
-
282
-
283
-
284
-
285
-
286
-
287
-
288
-
289
-
290
-
291
-
292
-
293
-
294
-
295
-
296
-
297
-
298
-
299
-
300
-
301
-
302
 |
 |

CAPITAL ONE FINANCIAL CORPORATION
NOTES TO CONSOLIDATED FINANCIAL STATEMENTS—(Continued)
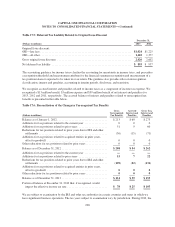
Expected future benefit payments
The following benefit payments, which reflect expected future service, as appropriate, are expected to be paid:
Table 16.7 Expected Future Benefits Payments
(Dollars in millions)
Pension
Benefits
Postretirement
Benefits
2014 ................................................................... $12 $ 2
2015 ................................................................... 12 4
2016 ................................................................... 12 4
2017 ................................................................... 11 4
2018 ................................................................... 11 4
2019 - 2023 ............................................................. 56 17
In 2014, $1 million in contributions are expected to be made to the pension plans and $2 million in contributions
are expected to be made to other postretirement benefits plans.
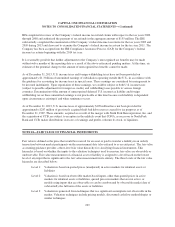
NOTE 17—INCOME TAXES
We account for income taxes in accordance with the accounting guidance prescribed by the FASB, recognizing
the current and deferred tax consequences of all transactions that have been recognized in the consolidated
financial statements using the provisions of enacted tax laws. Deferred tax assets and liabilities are determined
based on differences between the financial reporting and tax basis of assets and liabilities and are measured using
the enacted tax rates and laws that will be in effect when the differences are expected to reverse. Valuation
allowances are recorded to reduce deferred tax assets to an amount that is more likely than not to be realized.
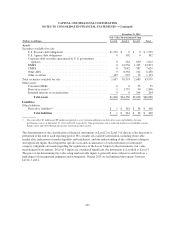
Table 17.1: Significant Components of the Provision for Income Taxes Attributable to Continuing
Operations
Year Ended December 31,
(Dollars in millions) 2013 2012 2011
Current income tax provision:
Federal taxes .......................................................... $1,360 $1,401 $ 721
State taxes ............................................................ 194 154 89
International taxes ..................................................... 115 44 33
Total current provision (benefit) .......................................... $1,669 $1,599 $ 843
Deferred income tax provision:
Federal taxes .......................................................... $ 305 $ (232) $ 594
State taxes ............................................................ 47 (84) (88)
International taxes ..................................................... 418 (15)
Total deferred provision (benefit) ......................................... $ 356 $ (298) $ 491
Total income tax provision ............................................... $2,025 $1,301 $1,334
The international income tax provision is related to pre-tax earnings from foreign operations of approximately
$459 million in 2013, $296 million in 2012, and $28 million in 2011.
225