Capital One 2013 Annual Report Download - page 256
Download and view the complete annual report
Please find page 256 of the 2013 Capital One annual report below. You can navigate through the pages in the report by either clicking on the pages listed below, or by using the keyword search tool below to find specific information within the annual report.-
 1
1 -
2
-
3
-
4
-
5
-
6
-
7
-
8
-
9
-
10
-
11
-
12
-
13
-
14
-
15
-
16
-
17
-
18
-
19
-
20
-
21
-
22
-
23
-
24
-
25
-
26
-
27
-
28
-
29
-
30
-
31
-
32
-
33
-
34
-
35
-
36
-
37
-
38
-
39
-
40
-
41
-
42
-
43
-
44
-
45
-
46
-
47
-
48
-
49
-
50
-
51
-
52
-
53
-
54
-
55
-
56
-
57
-
58
-
59
-
60
-
61
-
62
-
63
-
64
-
65
-
66
-
67
-
68
-
69
-
70
-
71
-
72
-
73
-
74
-
75
-
76
-
77
-
78
-
79
-
80
-
81
-
82
-
83
-
84
-
85
-
86
-
87
-
88
-
89
-
90
-
91
-
92
-
93
-
94
-
95
-
96
-
97
-
98
-
99
-
100
-
101
-
102
-
103
-
104
-
105
-
106
-
107
-
108
-
109
-
110
-
111
-
112
-
113
-
114
-
115
-
116
-
117
-
118
-
119
-
120
-
121
-
122
-
123
-
124
-
125
-
126
-
127
-
128
-
129
-
130
-
131
-
132
-
133
-
134
-
135
-
136
-
137
-
138
-
139
-
140
-
141
-
142
-
143
-
144
-
145
-
146
-
147
-
148
-
149
-
150
-
151
-
152
-
153
-
154
-
155
-
156
-
157
-
158
-
159
-
160
-
161
-
162
-
163
-
164
-
165
-
166
-
167
-
168
-
169
-
170
-
171
-
172
-
173
-
174
-
175
-
176
-
177
-
178
-
179
-
180
-
181
-
182
-
183
-
184
-
185
-
186
-
187
-
188
-
189
-
190
-
191
-
192
-
193
-
194
-
195
-
196
-
197
-
198
-
199
-
200
-
201
-
202
-
203
-
204
-
205
-
206
-
207
-
208
-
209
-
210
-
211
-
212
-
213
-
214
-
215
-
216
-
217
-
218
-
219
-
220
-
221
-
222
-
223
-
224
-
225
-
226
-
227
-
228
-
229
-
230
-
231
-
232
-
233
-
234
-
235
-
236
-
237
-
238
-
239
-
240
-
241
-
242
-
243
-
244
-
245
-
 246
246 -
 247
247 -
 248
248 -
 249
249 -
 250
250 -
 251
251 -
 252
252 -
 253
253 -
 254
254 -
 255
255 -
 256
256 -
 257
257 -
 258
258 -
 259
259 -
 260
260 -
 261
261 -
 262
262 -
 263
263 -
 264
264 -
 265
265 -
 266
266 -
267
-
268
-
269
-
270
-
271
-
272
-
273
-
274
-
275
-
276
-
277
-
278
-
279
-
280
-
281
-
282
-
283
-
284
-
285
-
286
-
287
-
288
-
289
-
290
-
291
-
292
-
293
-
294
-
295
-
296
-
297
-
298
-
299
-
300
-
301
-
302
 |
 |

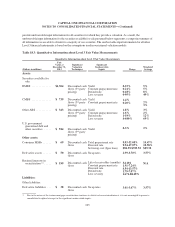
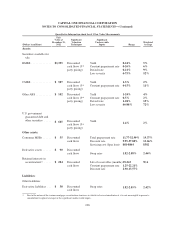
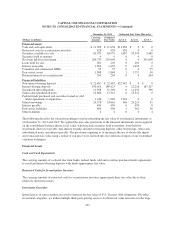
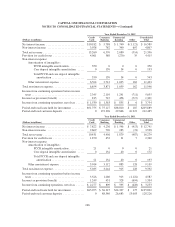
CAPITAL ONE FINANCIAL CORPORATION
NOTES TO CONSOLIDATED FINANCIAL STATEMENTS—(Continued)
Quantitative Information about Level 3 Fair Value Measurements
(Dollars in millions)
Fair
Value at
December 31,
2012
Significant
Valuation
Techniques
Significant
Unobservable
Inputs Range
Weighted
Average
Assets:
Securities available for
sale:
RMBS .............. $1,335 Discounted
cash flows (3rd
party pricing)
Yield
Constant prepayment rate
Default rate
Loss severity
0-24%
0-26%
0-21%
4-75%
5%
6%
9%
52%
CMBS .............. $ 587 Discounted
cash flows (3rd
party pricing)
Yield
Constant prepayment rate
1-3%
0-15%
2%
11%
Other ABS........... $ 102 Discounted
cash flows (3rd
party pricing)
Yield
Constant prepayment rate
Default rate
Loss severity
1-24%
0-5%
1-28%
46-88%
4%
2%
15%
72%
U.S. government
guaranteed debt and
other securities ..... $ 665 Discounted
cash flows (3rd
party pricing)
Yield 1-4% 2%
Other assets:
Consumer MSRs ...... $ 55 Discounted
cash flows
Total prepayment rate
Discount rate
Servicing cost ($per loan)
11.77-32.99%
9.95-37.88%
$81-$864
19.37%
12.66%
$302
Derivative assets ...... $ 90 Discounted
cash flows Swap rates 1.82-2.58% 2.46%
Retained interests in
securitization(1) ..... $ 204 Discounted
cash flows
Life of receivables (months)
Constant prepayment rate
Discount rate
29-243
1.25-22.21%
2.90-13.57%
N/A
Liabilities:
Other liabilities:
Derivative liabilities . . . $ 38 Discounted
cash flows
Swap rates 1.82-2.55% 2.42%
(1) Due to the nature of the various mortgage securitization structures in which we have retained interest, it is not meaningful to present a
consolidated weighted average for the significant unobservable inputs.
236