Capital One 2013 Annual Report Download - page 202
Download and view the complete annual report
Please find page 202 of the 2013 Capital One annual report below. You can navigate through the pages in the report by either clicking on the pages listed below, or by using the keyword search tool below to find specific information within the annual report.-
 1
1 -
2
-
3
-
4
-
5
-
6
-
7
-
8
-
9
-
10
-
11
-
12
-
13
-
14
-
15
-
16
-
17
-
18
-
19
-
20
-
21
-
22
-
23
-
24
-
25
-
26
-
27
-
28
-
29
-
30
-
31
-
32
-
33
-
34
-
35
-
36
-
37
-
38
-
39
-
40
-
41
-
42
-
43
-
44
-
45
-
46
-
47
-
48
-
49
-
50
-
51
-
52
-
53
-
54
-
55
-
56
-
57
-
58
-
59
-
60
-
61
-
62
-
63
-
64
-
65
-
66
-
67
-
68
-
69
-
70
-
71
-
72
-
73
-
74
-
75
-
76
-
77
-
78
-
79
-
80
-
81
-
82
-
83
-
84
-
85
-
86
-
87
-
88
-
89
-
90
-
91
-
92
-
93
-
94
-
95
-
96
-
97
-
98
-
99
-
100
-
101
-
102
-
103
-
104
-
105
-
106
-
107
-
108
-
109
-
110
-
111
-
112
-
113
-
114
-
115
-
116
-
117
-
118
-
119
-
120
-
121
-
122
-
123
-
124
-
125
-
126
-
127
-
128
-
129
-
130
-
131
-
132
-
133
-
134
-
135
-
136
-
137
-
138
-
139
-
140
-
141
-
142
-
143
-
144
-
145
-
146
-
147
-
148
-
149
-
150
-
151
-
152
-
153
-
154
-
155
-
156
-
157
-
158
-
159
-
160
-
161
-
162
-
163
-
164
-
165
-
166
-
167
-
168
-
169
-
170
-
171
-
172
-
173
-
174
-
175
-
176
-
177
-
178
-
179
-
180
-
181
-
182
-
183
-
184
-
185
-
186
-
187
-
188
-
189
-
190
-
191
-
 192
192 -
 193
193 -
 194
194 -
 195
195 -
 196
196 -
 197
197 -
 198
198 -
 199
199 -
 200
200 -
 201
201 -
 202
202 -
 203
203 -
 204
204 -
 205
205 -
 206
206 -
 207
207 -
 208
208 -
 209
209 -
 210
210 -
 211
211 -
 212
212 -
213
-
214
-
215
-
216
-
217
-
218
-
219
-
220
-
221
-
222
-
223
-
224
-
225
-
226
-
227
-
228
-
229
-
230
-
231
-
232
-
233
-
234
-
235
-
236
-
237
-
238
-
239
-
240
-
241
-
242
-
243
-
244
-
245
-
246
-
247
-
248
-
249
-
250
-
251
-
252
-
253
-
254
-
255
-
256
-
257
-
258
-
259
-
260
-
261
-
262
-
263
-
264
-
265
-
266
-
267
-
268
-
269
-
270
-
271
-
272
-
273
-
274
-
275
-
276
-
277
-
278
-
279
-
280
-
281
-
282
-
283
-
284
-
285
-
286
-
287
-
288
-
289
-
290
-
291
-
292
-
293
-
294
-
295
-
296
-
297
-
298
-
299
-
300
-
301
-
302
 |
 |

CAPITAL ONE FINANCIAL CORPORATION
NOTES TO CONSOLIDATED FINANCIAL STATEMENTS—(Continued)
December 31, 2012
(Dollars in millions)
With an
Allowance
Without
an
Allowance
Total
Recorded
Investment
Related
Allowance
Net
Recorded
Investment
Unpaid
Principal
Balance
Average
Recorded
Investment
Interest
Income
Recognized
Credit card and installment
loans:
Domestic credit card and
installment loans ............ $ 701 $ 0 $ 701 $230 $ 471 $ 678 $ 687 $ 70
International credit card . . . . . . . . 172 0 172 101 71 164 192 11
Total credit card and installment
loans(2) ................... 873 0 873 331 542 842 879 81
Consumer Banking:
Auto(3) ...................... 169 159 328 20 308 606 130 31
Home loan .................. 145 0 145 13 132 167 120 4
Retail banking ............... 61 35 96 7 89 118 88 3
Total consumer banking . . . . . . . . 375 194 569 40 529 891 338 38
Commercial Banking:
Commercial and multifamily real
estate ..................... 168 112 280 32 248 315 353 8
Commercial and industrial . . . . . . 152 92 244 22 222 277 227 6
Total commercial lending . . . . . . 320 204 524 54 470 592 580 14
Small-ticket commercial real
estate ..................... 3 11 14 1 13 21 23 0
Total commercial banking . . . . . . 323 215 538 55 483 613 603 14
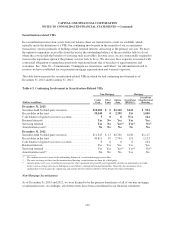
Total ....................... $1,571 $409 $1,980 $426 $1,554 $2,346 $1,820 $133
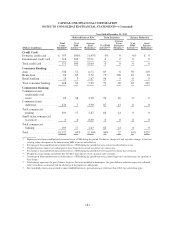
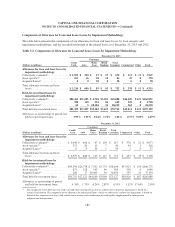
(1) Impaired Loans above include TDRs, all Commercial NPL’s, and Home Loans NPL’s with a specific impairment starting in 2013.
(2) Credit card and installment loans include finance charges and fees.
(3) Although auto loans from Loan Recovery Inventory (“LRI”) are not included in our loans held for investment, they are included as
impaired loans above since they are reported as TDRs.
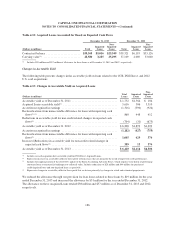
Troubled debt restructuring loans accounted for $1.7 billion and $1.8 billion of impaired loans as of
December 31, 2013 and 2012, respectively. Consumer TDR loans classified as performing totaled $1.1 billion
and $1.2 billion as of December 31, 2013 and 2012, respectively. Commercial TDR loans classified as
performing totaled $180 million and $253 million as of December 31, 2013 and 2012, respectively.
182