Capital One 2013 Annual Report Download - page 85
Download and view the complete annual report
Please find page 85 of the 2013 Capital One annual report below. You can navigate through the pages in the report by either clicking on the pages listed below, or by using the keyword search tool below to find specific information within the annual report.-
 1
1 -
2
-
3
-
4
-
5
-
6
-
7
-
8
-
9
-
10
-
11
-
12
-
13
-
14
-
15
-
16
-
17
-
18
-
19
-
20
-
21
-
22
-
23
-
24
-
25
-
26
-
27
-
28
-
29
-
30
-
31
-
32
-
33
-
34
-
35
-
36
-
37
-
38
-
39
-
40
-
41
-
42
-
43
-
44
-
45
-
46
-
47
-
48
-
49
-
50
-
51
-
52
-
53
-
54
-
55
-
56
-
57
-
58
-
59
-
60
-
61
-
62
-
63
-
64
-
65
-
66
-
67
-
68
-
69
-
70
-
71
-
72
-
73
-
74
-
 75
75 -
 76
76 -
 77
77 -
 78
78 -
 79
79 -
 80
80 -
 81
81 -
 82
82 -
 83
83 -
 84
84 -
 85
85 -
 86
86 -
 87
87 -
 88
88 -
 89
89 -
 90
90 -
 91
91 -
 92
92 -
 93
93 -
 94
94 -
 95
95 -
96
-
97
-
98
-
99
-
100
-
101
-
102
-
103
-
104
-
105
-
106
-
107
-
108
-
109
-
110
-
111
-
112
-
113
-
114
-
115
-
116
-
117
-
118
-
119
-
120
-
121
-
122
-
123
-
124
-
125
-
126
-
127
-
128
-
129
-
130
-
131
-
132
-
133
-
134
-
135
-
136
-
137
-
138
-
139
-
140
-
141
-
142
-
143
-
144
-
145
-
146
-
147
-
148
-
149
-
150
-
151
-
152
-
153
-
154
-
155
-
156
-
157
-
158
-
159
-
160
-
161
-
162
-
163
-
164
-
165
-
166
-
167
-
168
-
169
-
170
-
171
-
172
-
173
-
174
-
175
-
176
-
177
-
178
-
179
-
180
-
181
-
182
-
183
-
184
-
185
-
186
-
187
-
188
-
189
-
190
-
191
-
192
-
193
-
194
-
195
-
196
-
197
-
198
-
199
-
200
-
201
-
202
-
203
-
204
-
205
-
206
-
207
-
208
-
209
-
210
-
211
-
212
-
213
-
214
-
215
-
216
-
217
-
218
-
219
-
220
-
221
-
222
-
223
-
224
-
225
-
226
-
227
-
228
-
229
-
230
-
231
-
232
-
233
-
234
-
235
-
236
-
237
-
238
-
239
-
240
-
241
-
242
-
243
-
244
-
245
-
246
-
247
-
248
-
249
-
250
-
251
-
252
-
253
-
254
-
255
-
256
-
257
-
258
-
259
-
260
-
261
-
262
-
263
-
264
-
265
-
266
-
267
-
268
-
269
-
270
-
271
-
272
-
273
-
274
-
275
-
276
-
277
-
278
-
279
-
280
-
281
-
282
-
283
-
284
-
285
-
286
-
287
-
288
-
289
-
290
-
291
-
292
-
293
-
294
-
295
-
296
-
297
-
298
-
299
-
300
-
301
-
302
 |
 |

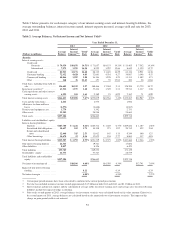
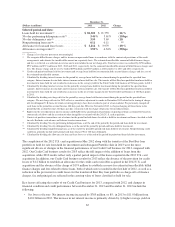
December 31,
(Dollars in millions) 2013 2012 Change
Selected period-end data:
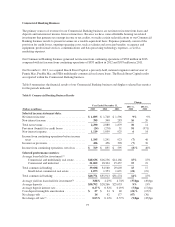
Loans held for investment(2) .................. $ 81,305 $ 91,755 (11)%
30+ day performing delinquency rate(8) .......... 3.46% 3.61% (15)bps
30+ day delinquency rate(9) ................... 3.54 3.69 (15)
Nonperforming loan rate(10) ................... 0.11 0.11 **
Allowance for loan and lease losses . ........... $ 3,214 $ 3,979 (19)%
Allowance coverage ratio(11) .................. 3.95% 4.34% (39)bps
** Change is less than one percent or not meaningful.
(1) We recognize billed finance charges and fee income on open-ended loans in accordance with the contractual provisions of the credit
arrangements and estimate the uncollectible amount on a quarterly basis. The estimated uncollectible amount of billed finance charges
and fees is reflected as a reduction in revenue and is not included in our net charge-offs. Total net revenue was reduced by $796 million,
$937 million and $371 million in 2013, 2012 and 2011, respectively, for the estimated uncollectible amount of billed finance charges and
fees. The finance charge and fee reserve totaled $190 million and $307 million as of December 31, 2013 and 2012, respectively.
(2) Credit card period-end loans held for investment and average loans held for investment include accrued finance charges and fees, net of
the estimated uncollectible amount.
(3) Calculated by dividing interest income for the period by average loans held for investment during the period for the specified loan
category. Interest income also includes interest income on loans held for sale. The transfer of Best Buy loan portfolio from loans held for
investment to loans held for sale resulted in an increase in the average yield for the Total Credit Card business of 90 basis points in 2013.
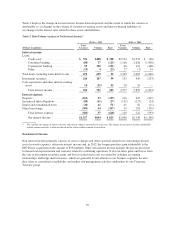
(4) Calculated by dividing total net revenue for the period by average loans held for investment during the period for the specified loan
category. Interest income also includes interest income on loans held for sale. The transfer of Best Buy loan portfolio from loans held for
investment to loans held for sale resulted in an increase in the net revenue margin for the Total Credit Card business of 100 basis points
in 2013.
(5) Calculated by dividing net charge-offs for the period by average loans held for investment during the period for the specified loan
category. The net charge-off rate for 2012 reflects a cumulative adjustment we made in November 2012 related to the timing of charge-
offs for delinquent U.K. loans for which revolving privileges have been revoked as part of a loan workout. We previously charged off
such loans in the period the account became 180 days past due. Effective November 2012, we began charging off these loans in the
period that the account becomes 120 days past due, consistent with our charge-off practice for installment loans.
(6) Represents the net reduction in interest income attributable to the amortization of premiums on purchased loans accounted for based on
contractual cash flows and the accretion of other intangibles associated with the 2012 U.S. card acquisition.
(7) Consists of purchase transactions, net of returns for the period for both loans classified as held for investment and loans classified as held
for sale. Excludes cash advance and balance transfer transactions.
(8) Calculated by dividing 30+ day performing delinquent loans as of the end of the period by the period-end loans held for investment.
(9) Calculated by dividing 30+ day delinquent loans as of the end of the period by period-end loans held for investment.
(10) Calculated by dividing nonperforming loans as of the end of the period by period-end loans held for investment. Nonperforming credit
card loans generally include international card loans that are 90 or 120 days delinquent.
(11) Calculated by dividing the allowance for loan and lease losses as of the end of the period by period-end loans held for investment.
The completion of the 2012 U.S. card acquisition in May 2012 along with the transfer of the Best Buy loan
portfolio to held for sale from held for investment and subsequent Portfolio Sale in 2013 were the most
significant drivers of changes in the financial performance of our Credit Card business for 2013 compared with
2012. Our Credit Card business results for 2013 reflect the full impact of the addition of loans from the
acquisition, while 2012 results reflect only a partial period impact of the loans acquired in the 2012 U.S. card
acquisition. In addition, our Credit Card business results for 2013 reflect the absence of the provision for credit
losses of $1.2 billion to establish an allowance for the credit card receivables acquired in the 2012 U.S. card
acquisition and the absence of the charge of $174 million to establish a reserve for estimated uncollectible billed
finance charges and fees related to these loans, both of which were recorded in the first half of 2012, as well as a
reduction in the provision for credit losses for the transferred Best Buy loan portfolio as charge-offs of finance
charges, fee and principal are reflected in the carrying value of loans classified as held for sale.
Key factors affecting the results of our Credit Card business for 2013, compared with 2012, and changes in
financial condition and credit performance between December 31, 2013 and December 31, 2012 include the
following:
•Net Interest Income: Net interest income increased by $785 million, or 8%, in 2013 to $11.0 billion from
$10.2 billion in 2012. The increase in net interest income is primarily driven by (i) higher average yield on
65