Capital One 2013 Annual Report Download - page 102
Download and view the complete annual report
Please find page 102 of the 2013 Capital One annual report below. You can navigate through the pages in the report by either clicking on the pages listed below, or by using the keyword search tool below to find specific information within the annual report.-
 1
1 -
2
-
3
-
4
-
5
-
6
-
7
-
8
-
9
-
10
-
11
-
12
-
13
-
14
-
15
-
16
-
17
-
18
-
19
-
20
-
21
-
22
-
23
-
24
-
25
-
26
-
27
-
28
-
29
-
30
-
31
-
32
-
33
-
34
-
35
-
36
-
37
-
38
-
39
-
40
-
41
-
42
-
43
-
44
-
45
-
46
-
47
-
48
-
49
-
50
-
51
-
52
-
53
-
54
-
55
-
56
-
57
-
58
-
59
-
60
-
61
-
62
-
63
-
64
-
65
-
66
-
67
-
68
-
69
-
70
-
71
-
72
-
73
-
74
-
75
-
76
-
77
-
78
-
79
-
80
-
81
-
82
-
83
-
84
-
85
-
86
-
87
-
88
-
89
-
90
-
91
-
 92
92 -
 93
93 -
 94
94 -
 95
95 -
 96
96 -
 97
97 -
 98
98 -
 99
99 -
 100
100 -
 101
101 -
 102
102 -
 103
103 -
 104
104 -
 105
105 -
 106
106 -
 107
107 -
 108
108 -
 109
109 -
 110
110 -
 111
111 -
 112
112 -
113
-
114
-
115
-
116
-
117
-
118
-
119
-
120
-
121
-
122
-
123
-
124
-
125
-
126
-
127
-
128
-
129
-
130
-
131
-
132
-
133
-
134
-
135
-
136
-
137
-
138
-
139
-
140
-
141
-
142
-
143
-
144
-
145
-
146
-
147
-
148
-
149
-
150
-
151
-
152
-
153
-
154
-
155
-
156
-
157
-
158
-
159
-
160
-
161
-
162
-
163
-
164
-
165
-
166
-
167
-
168
-
169
-
170
-
171
-
172
-
173
-
174
-
175
-
176
-
177
-
178
-
179
-
180
-
181
-
182
-
183
-
184
-
185
-
186
-
187
-
188
-
189
-
190
-
191
-
192
-
193
-
194
-
195
-
196
-
197
-
198
-
199
-
200
-
201
-
202
-
203
-
204
-
205
-
206
-
207
-
208
-
209
-
210
-
211
-
212
-
213
-
214
-
215
-
216
-
217
-
218
-
219
-
220
-
221
-
222
-
223
-
224
-
225
-
226
-
227
-
228
-
229
-
230
-
231
-
232
-
233
-
234
-
235
-
236
-
237
-
238
-
239
-
240
-
241
-
242
-
243
-
244
-
245
-
246
-
247
-
248
-
249
-
250
-
251
-
252
-
253
-
254
-
255
-
256
-
257
-
258
-
259
-
260
-
261
-
262
-
263
-
264
-
265
-
266
-
267
-
268
-
269
-
270
-
271
-
272
-
273
-
274
-
275
-
276
-
277
-
278
-
279
-
280
-
281
-
282
-
283
-
284
-
285
-
286
-
287
-
288
-
289
-
290
-
291
-
292
-
293
-
294
-
295
-
296
-
297
-
298
-
299
-
300
-
301
-
302
 |
 |
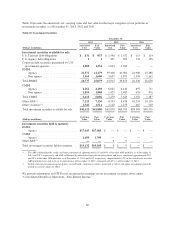
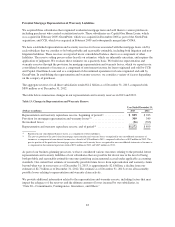
Period-end loans held for investment decreased by $8.7 billion, or 4%, in 2013, to $197.2 billion as of
December 31, 2013, from $205.9 billion as of December 31, 2012. The decrease was due in part to the transfer of
the Best Buy loan portfolio of $7 billion at the date of transfer to the loans held for sale in the first quarter of
2013, which were further sold in the third quarter of 2013. In addition to the Portfolio Sale, period-end loans held
for investment decreased due to expected run-off of certain other credit card loans acquired in the 2012 U.S. card
acquisition and continued expected run-off of installment loans in our Credit Card business and home loans in
our Consumer Banking business. The paydowns and run-off of card balances were partially offset by growth in
certain segments of our Credit Card business, higher period-end auto loan balances due to the continued high
volume of auto loan originations and strong loan originations in our commercial and industrial and commercial
real estate loan portfolios.
We provide additional information on the composition of our loan portfolio and credit quality below in “Credit
Risk Profile” and in “Note 4—Loans.”
Loans Held for Sale
Loans held for sale, which are carried at lower of cost or fair value, increased to $218 million as of December 31,
2013, from $201 million as of December 31, 2012. We provide additional information for loans held for sale in
“Note 4—Loans.”
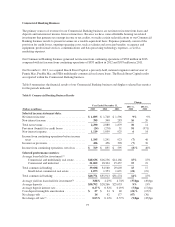
Customer Deposits
Our customer deposits have become our largest source of funding for our operations, providing a sizable and
consistent source of low-cost funds. Total customer deposits decreased by $8.0 billion to $204.5 billion as of
December 31, 2013, from $212.5 billion as of December 31, 2012, reflecting our scaling back of deposit growth
in the current environment of relatively low overall loan growth. We provide information on the composition of
our deposits, average outstanding balances, interest expense and yield below in “Liquidity Risk Profile.”
Securitized Debt Obligations
Securitization debt obligations decreased by $1.1 billion during 2013 to $10.3 billion as of December 31, 2013,
from $11.4 billion as of December 31, 2012. The decrease was driven by maturities and repurchases totaling
$3.3 billion, partially offset by the issuance of $2.2 billion of credit card securitization debt during 2013.
Other Debt
Other debt, which consists of federal funds purchased and securities loaned or sold under agreements to
repurchase, senior and subordinated notes and other borrowings, including Federal Home Loan Bank (“FHLB”)
advances, but excluding securitized debt obligations, totaled $30.4 billion as of December 31, 2013, of which
$16.2 billion represented short-term borrowings and $14.2 billion represented long-term debt. Other debt
decreased by $8.1 billion in 2013 from a total of $38.5 billion as of December 31, 2012, of which $21.1 billion
represented short-term borrowings and $17.4 billion represented long-term borrowings.
The decrease in other debt was primarily attributable to our redemption of $3.65 billion junior subordinated debt
in connection with our redemption of outstanding trust preferred securities in the first quarter of 2013, as well as
net maturities of FHLB advances of $4.6 billion during 2013. The above decreases were partially offset by the
issuance of $2.0 billion unsecured senior notes during 2013. We provide additional information on our
borrowings in “Note 9—Deposits and Borrowings.”
82