Capital One 2013 Annual Report Download - page 130
Download and view the complete annual report
Please find page 130 of the 2013 Capital One annual report below. You can navigate through the pages in the report by either clicking on the pages listed below, or by using the keyword search tool below to find specific information within the annual report.-
 1
1 -
2
-
3
-
4
-
5
-
6
-
7
-
8
-
9
-
10
-
11
-
12
-
13
-
14
-
15
-
16
-
17
-
18
-
19
-
20
-
21
-
22
-
23
-
24
-
25
-
26
-
27
-
28
-
29
-
30
-
31
-
32
-
33
-
34
-
35
-
36
-
37
-
38
-
39
-
40
-
41
-
42
-
43
-
44
-
45
-
46
-
47
-
48
-
49
-
50
-
51
-
52
-
53
-
54
-
55
-
56
-
57
-
58
-
59
-
60
-
61
-
62
-
63
-
64
-
65
-
66
-
67
-
68
-
69
-
70
-
71
-
72
-
73
-
74
-
75
-
76
-
77
-
78
-
79
-
80
-
81
-
82
-
83
-
84
-
85
-
86
-
87
-
88
-
89
-
90
-
91
-
92
-
93
-
94
-
95
-
96
-
97
-
98
-
99
-
100
-
101
-
102
-
103
-
104
-
105
-
106
-
107
-
108
-
109
-
110
-
111
-
112
-
113
-
114
-
115
-
116
-
117
-
118
-
119
-
 120
120 -
 121
121 -
 122
122 -
 123
123 -
 124
124 -
 125
125 -
 126
126 -
 127
127 -
 128
128 -
 129
129 -
 130
130 -
 131
131 -
 132
132 -
 133
133 -
 134
134 -
 135
135 -
 136
136 -
 137
137 -
 138
138 -
 139
139 -
 140
140 -
141
-
142
-
143
-
144
-
145
-
146
-
147
-
148
-
149
-
150
-
151
-
152
-
153
-
154
-
155
-
156
-
157
-
158
-
159
-
160
-
161
-
162
-
163
-
164
-
165
-
166
-
167
-
168
-
169
-
170
-
171
-
172
-
173
-
174
-
175
-
176
-
177
-
178
-
179
-
180
-
181
-
182
-
183
-
184
-
185
-
186
-
187
-
188
-
189
-
190
-
191
-
192
-
193
-
194
-
195
-
196
-
197
-
198
-
199
-
200
-
201
-
202
-
203
-
204
-
205
-
206
-
207
-
208
-
209
-
210
-
211
-
212
-
213
-
214
-
215
-
216
-
217
-
218
-
219
-
220
-
221
-
222
-
223
-
224
-
225
-
226
-
227
-
228
-
229
-
230
-
231
-
232
-
233
-
234
-
235
-
236
-
237
-
238
-
239
-
240
-
241
-
242
-
243
-
244
-
245
-
246
-
247
-
248
-
249
-
250
-
251
-
252
-
253
-
254
-
255
-
256
-
257
-
258
-
259
-
260
-
261
-
262
-
263
-
264
-
265
-
266
-
267
-
268
-
269
-
270
-
271
-
272
-
273
-
274
-
275
-
276
-
277
-
278
-
279
-
280
-
281
-
282
-
283
-
284
-
285
-
286
-
287
-
288
-
289
-
290
-
291
-
292
-
293
-
294
-
295
-
296
-
297
-
298
-
299
-
300
-
301
-
302
 |
 |

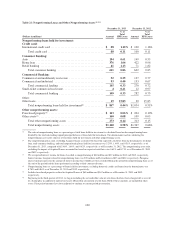
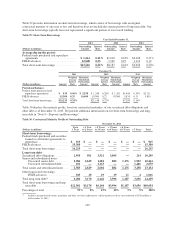
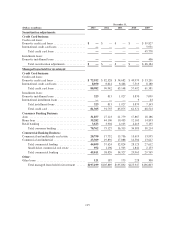
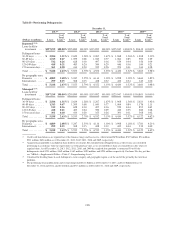
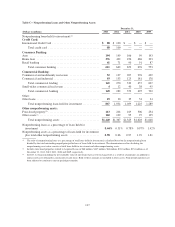
We provide additional information on our short-term borrowings and long-term debt above under “Consolidated
Balance Sheets Analysis—Securitized Debt Obligations,” “Consolidated Balance Sheet Analysis—Other Debt”
and in “Note 9—Deposits and Borrowings.”
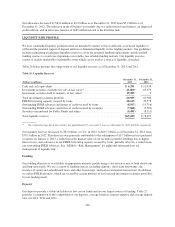
Borrowing Capacity
Under our shelf registration statement filed with the U.S. Securities and Exchange Commission on April 30,
2012, from time to time, we may offer and sell an indeterminate aggregate amount of senior or subordinated debt
securities, preferred stock, depository shares, common stock, purchase contracts, warrants and units. There is no
limit under this shelf registration statement to the amount or number of such securities that we may offer and sell,
subject to market conditions. Our current shelf registration statement will expire three years from the filing date.
In addition to our issuance capacity under the shelf registration statement, we also have access to FHLB advances
with a maximum borrowing capacity of $37.1 billion as of December 31, 2013. This borrowing capacity was
secured by posting $28.6 billion of loans and $8.5 billion of securities as collateral. We had outstanding FHLB
advances and letters of credit of $16.7 billion as of December 31, 2013, and $20.4 billion still available to us to
borrow under this program. The ability to draw down funding is based on membership status and the amount is
dependent upon the Banks’ ability to post collateral. Our FHLB membership is secured by our investment in
FHLB stock of $774 million and $1.3 billion as of December 31, 2013 and 2012, respectively, which are
determined based on our outstanding advances.
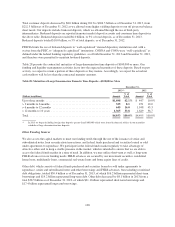
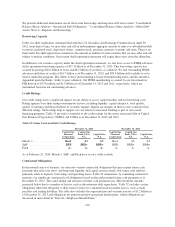
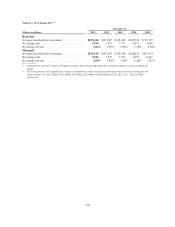
Credit Ratings
Our credit ratings have a significant impact on our ability to access capital markets and our borrowing costs.
Rating agencies base their ratings on numerous factors, including liquidity, capital adequacy, asset quality,
quality of earnings and the probability of systemic support. Significant changes in these factors could result in
different ratings. Such ratings help to support our cost effective unsecured funding as part of our overall
financing programs. Table 31 provides a summary of the credit ratings for the senior unsecured debt of Capital
One Financial Corporation, COBNA and CONA as of December 31, 2013 and 2012.
Table 31: Senior Unsecured Debt Credit Ratings
December 31, 2013 December 31, 2012
Capital One
Financial
Corporation
Capital One
Bank (USA),
N.A.
Capital One,
N.A.
Capital One
Financial
Corporation
Capital One
Bank (USA),
N.A.
Capital One,
N.A.
Moody’s .................. Baa1 A3 A3 Baa1 A3 A3
S&P ..................... BBB BBB+ BBB+ BBB BBB+ BBB+
Fitch ..................... A- A- A- A- A- A-
As of February 25, 2014, Moody’s, S&P, and Fitch have us on a stable outlook.
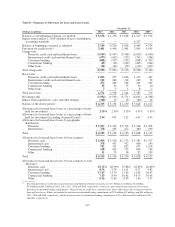
Contractual Obligations
In the normal course of business, we enter into various contractual obligations that may require future cash
payments that affect our short- and long-term liquidity and capital resource needs. Our future cash outflows
primarily relate to deposits, borrowings and operating leases. Table 32 summarizes, by remaining contractual
maturity, our significant contractual cash obligations based on the undiscounted future cash payments as of
December 31, 2013. The actual timing and amounts of future cash payments may differ from the amounts
presented below due to a number of factors, such as discretionary debt repurchases. Table 32 excludes certain
obligations where the obligation is short-term or subject to valuation based on market factors, such as trade
payables and trading liabilities. The table also excludes the representation and warranty reserve of $1.2 billion as
of December 31, 2013 and obligations for pension and post-retirement benefit plans, which obligations are
discussed in more detail in “Note 16—Employee Benefit Plans.”
110