Capital One 2013 Annual Report Download - page 125
Download and view the complete annual report
Please find page 125 of the 2013 Capital One annual report below. You can navigate through the pages in the report by either clicking on the pages listed below, or by using the keyword search tool below to find specific information within the annual report.-
 1
1 -
2
-
3
-
4
-
5
-
6
-
7
-
8
-
9
-
10
-
11
-
12
-
13
-
14
-
15
-
16
-
17
-
18
-
19
-
20
-
21
-
22
-
23
-
24
-
25
-
26
-
27
-
28
-
29
-
30
-
31
-
32
-
33
-
34
-
35
-
36
-
37
-
38
-
39
-
40
-
41
-
42
-
43
-
44
-
45
-
46
-
47
-
48
-
49
-
50
-
51
-
52
-
53
-
54
-
55
-
56
-
57
-
58
-
59
-
60
-
61
-
62
-
63
-
64
-
65
-
66
-
67
-
68
-
69
-
70
-
71
-
72
-
73
-
74
-
75
-
76
-
77
-
78
-
79
-
80
-
81
-
82
-
83
-
84
-
85
-
86
-
87
-
88
-
89
-
90
-
91
-
92
-
93
-
94
-
95
-
96
-
97
-
98
-
99
-
100
-
101
-
102
-
103
-
104
-
105
-
106
-
107
-
108
-
109
-
110
-
111
-
112
-
113
-
114
-
 115
115 -
 116
116 -
 117
117 -
 118
118 -
 119
119 -
 120
120 -
 121
121 -
 122
122 -
 123
123 -
 124
124 -
 125
125 -
 126
126 -
 127
127 -
 128
128 -
 129
129 -
 130
130 -
 131
131 -
 132
132 -
 133
133 -
 134
134 -
 135
135 -
136
-
137
-
138
-
139
-
140
-
141
-
142
-
143
-
144
-
145
-
146
-
147
-
148
-
149
-
150
-
151
-
152
-
153
-
154
-
155
-
156
-
157
-
158
-
159
-
160
-
161
-
162
-
163
-
164
-
165
-
166
-
167
-
168
-
169
-
170
-
171
-
172
-
173
-
174
-
175
-
176
-
177
-
178
-
179
-
180
-
181
-
182
-
183
-
184
-
185
-
186
-
187
-
188
-
189
-
190
-
191
-
192
-
193
-
194
-
195
-
196
-
197
-
198
-
199
-
200
-
201
-
202
-
203
-
204
-
205
-
206
-
207
-
208
-
209
-
210
-
211
-
212
-
213
-
214
-
215
-
216
-
217
-
218
-
219
-
220
-
221
-
222
-
223
-
224
-
225
-
226
-
227
-
228
-
229
-
230
-
231
-
232
-
233
-
234
-
235
-
236
-
237
-
238
-
239
-
240
-
241
-
242
-
243
-
244
-
245
-
246
-
247
-
248
-
249
-
250
-
251
-
252
-
253
-
254
-
255
-
256
-
257
-
258
-
259
-
260
-
261
-
262
-
263
-
264
-
265
-
266
-
267
-
268
-
269
-
270
-
271
-
272
-
273
-
274
-
275
-
276
-
277
-
278
-
279
-
280
-
281
-
282
-
283
-
284
-
285
-
286
-
287
-
288
-
289
-
290
-
291
-
292
-
293
-
294
-
295
-
296
-
297
-
298
-
299
-
300
-
301
-
302
 |
 |

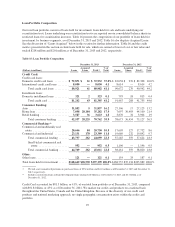
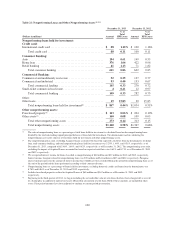
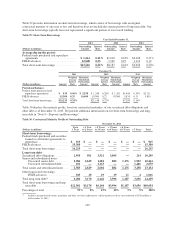
(1) The total provision for credit losses reported in our consolidated statements of income of $3.5 billion, $4.4 billion and $2.4 billion in
2013, 2012 and 2011, respectively, consists of a provision for loan and lease losses and a provision for unfunded lending commitments.
The provision for credit losses reported in the above table relates only to the provision for loan and lease losses. It does not include the
provision for unfunded lending commitments of $52 million in 2013, and the provision release for unfunded lending commitments of
$31 and $41 million in 2012 and 2011, respectively.
(2) Consists of a reduction in the allowance of $289 million, which was attributable to the Portfolio Sale, in the first quarter of 2013. It also
contains a foreign translation and other adjustment of $19 million, $15 million, and $8 million in 2013, 2012, and 2011, respectively.
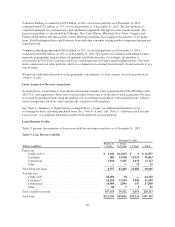
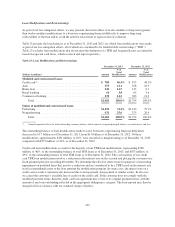
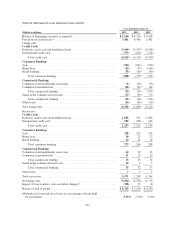
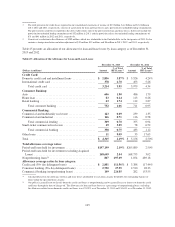
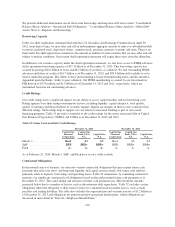
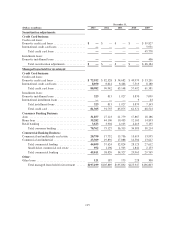
Table 25 presents an allocation of our allowance for loan and lease losses by loan category as of December 31,
2013 and 2012.
Table 25: Allocation of the Allowance for Loan and Lease Losses
December 31, 2013 December 31, 2012
(Dollars in millions) Amount
% of Total
HFI Loans(1) Amount
% of Total
HFI Loans(1)
Credit Card:
Domestic credit card and installment loans ................ $ 2,836 3.87% $ 3,526 4.24%
International credit card ............................... 378 4.70 453 5.26
Total credit card ................................. 3,214 3.95 3,979 4.34
Consumer Banking:
Auto .............................................. 606 1.90 486 1.79
Home loan .......................................... 83 0.24 113 0.26
Retail banking ....................................... 63 1.74 112 2.87
Total consumer banking ........................... 752 1.06 711 0.95
Commercial Banking:
Commercial and multifamily real estate ................... 143 0.69 239 1.35
Commercial and industrial ............................. 166 0.71 116 0.58
Total commercial lending .......................... 309 0.70 355 0.94
Small-ticket commercial real estate ...................... 29 3.05 78 6.52
Total commercial banking ......................... 338 0.75 433 1.12
Other loans ......................................... 11 9.09 33 17.65
Total .............................................. $ 4,315 2.19% $ 5,156 2.50%
Total allowance coverage ratios:
Period-end loans held for investment ..................... $197,199 2.19% $205,889 2.50%
Period-end loans held for investment (excluding Acquired
Loans) ........................................... 168,649 2.54 168,755 3.02
Nonperforming loans(2) ................................ 867 497.69 1,054 489.18
Allowance coverage ratios by loan category:
Credit card (30+ day delinquent loans) ................... $ 2,881 111.56% $ 3,388 117.44%
Consumer banking (30+ day delinquent loans) ............. 2,750 27.35 2,510 28.33
Commercial banking (nonperforming loans) ............... 149 226.85 282 153.55
(1) Calculated based on the allowance for loan and lease losses attributable to each loan category divided by the outstanding balance of
loans within the specified loan category.
(2) Our policy is generally not to classify domestic credit card loans as nonperforming and we generally accrue interest on domestic credit
card loans through the date of charge-off. The allowance for loan and lease losses as a percentage of nonperforming loans, excluding
the allowance related to our domestic credit card loans, was 170.59% as of December 31, 2013 and 154.65% as of December 31, 2012.
105