Capital One 2013 Annual Report Download - page 101
Download and view the complete annual report
Please find page 101 of the 2013 Capital One annual report below. You can navigate through the pages in the report by either clicking on the pages listed below, or by using the keyword search tool below to find specific information within the annual report.-
 1
1 -
2
-
3
-
4
-
5
-
6
-
7
-
8
-
9
-
10
-
11
-
12
-
13
-
14
-
15
-
16
-
17
-
18
-
19
-
20
-
21
-
22
-
23
-
24
-
25
-
26
-
27
-
28
-
29
-
30
-
31
-
32
-
33
-
34
-
35
-
36
-
37
-
38
-
39
-
40
-
41
-
42
-
43
-
44
-
45
-
46
-
47
-
48
-
49
-
50
-
51
-
52
-
53
-
54
-
55
-
56
-
57
-
58
-
59
-
60
-
61
-
62
-
63
-
64
-
65
-
66
-
67
-
68
-
69
-
70
-
71
-
72
-
73
-
74
-
75
-
76
-
77
-
78
-
79
-
80
-
81
-
82
-
83
-
84
-
85
-
86
-
87
-
88
-
89
-
90
-
 91
91 -
 92
92 -
 93
93 -
 94
94 -
 95
95 -
 96
96 -
 97
97 -
 98
98 -
 99
99 -
 100
100 -
 101
101 -
 102
102 -
 103
103 -
 104
104 -
 105
105 -
 106
106 -
 107
107 -
 108
108 -
 109
109 -
 110
110 -
 111
111 -
112
-
113
-
114
-
115
-
116
-
117
-
118
-
119
-
120
-
121
-
122
-
123
-
124
-
125
-
126
-
127
-
128
-
129
-
130
-
131
-
132
-
133
-
134
-
135
-
136
-
137
-
138
-
139
-
140
-
141
-
142
-
143
-
144
-
145
-
146
-
147
-
148
-
149
-
150
-
151
-
152
-
153
-
154
-
155
-
156
-
157
-
158
-
159
-
160
-
161
-
162
-
163
-
164
-
165
-
166
-
167
-
168
-
169
-
170
-
171
-
172
-
173
-
174
-
175
-
176
-
177
-
178
-
179
-
180
-
181
-
182
-
183
-
184
-
185
-
186
-
187
-
188
-
189
-
190
-
191
-
192
-
193
-
194
-
195
-
196
-
197
-
198
-
199
-
200
-
201
-
202
-
203
-
204
-
205
-
206
-
207
-
208
-
209
-
210
-
211
-
212
-
213
-
214
-
215
-
216
-
217
-
218
-
219
-
220
-
221
-
222
-
223
-
224
-
225
-
226
-
227
-
228
-
229
-
230
-
231
-
232
-
233
-
234
-
235
-
236
-
237
-
238
-
239
-
240
-
241
-
242
-
243
-
244
-
245
-
246
-
247
-
248
-
249
-
250
-
251
-
252
-
253
-
254
-
255
-
256
-
257
-
258
-
259
-
260
-
261
-
262
-
263
-
264
-
265
-
266
-
267
-
268
-
269
-
270
-
271
-
272
-
273
-
274
-
275
-
276
-
277
-
278
-
279
-
280
-
281
-
282
-
283
-
284
-
285
-
286
-
287
-
288
-
289
-
290
-
291
-
292
-
293
-
294
-
295
-
296
-
297
-
298
-
299
-
300
-
301
-
302
 |
 |

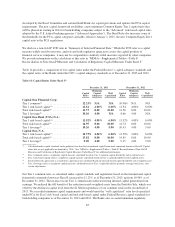
Credit Ratings
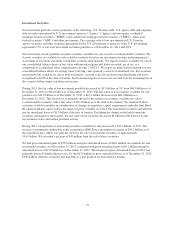
Our portfolio of investment securities continues to be concentrated in securities that generally have low credit
risk and high credit ratings, such as securities issued and guaranteed by the U.S. Treasury and other government
sponsored enterprises or agencies. Approximately 92% of our total investment securities portfolio was rated AA+
or its equivalent, or better as of both December 31, 2013 and 2012, while approximately 5% and 6% was below
investment grade as of December 31, 2013 and 2012, respectively. We categorize the credit ratings of our
investment securities based on the lowest credit rating as issued by the rating agencies Standard & Poor’s Ratings
Services (“S&P”), Moody’s Investors Service (“Moody’s”) and Fitch Ratings (“Fitch”).
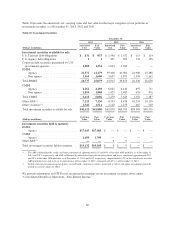
Table 11 provides information on the credit ratings of our non-agency RMBS, non-agency CMBS, other asset-
backed securities and other securities in our portfolio as of December 31, 2013 and 2012.
Table 11: Non-Agency Investment Securities Credit Ratings
December 31,
2013 2012
(Dollars in millions)
Amortized
Cost AAA
Other
Investment
Grade
Below
Investment
Grade or Not
Rated
Amortized
Cost AAA
Other
Investment
Grade
Below
Investment
Grade or Not
Rated
Non-agency RMBS .... $3,165 —% 4% 96% $3,607 —% 5% 95%
Non-agency CMBS .... 1,854 99 1 — 1,425 97 3 —
Other asset-backed
securities .......... 7,123 87 12 1 8,393 82 17 1
Other securities(1) ..... 1,542 9 82 9 1,120 67 24 9
(1) Includes foreign government/agency bonds, covered bonds, corporate securities, municipal securities and equity investments primarily
related to activities under the CRA.
For additional information on our investment securities, see “Note 3—Investment Securities.”
Loans Held for Investment
Total loans that we manage consist of held for investment loans recorded on our consolidated balance sheets and
loans held in our securitization trusts. Loans underlying our securitization trusts are reported on our consolidated
balance sheets in restricted loans for securitization investors. Table 12 summarizes our portfolio of loans held for
investment by business segment, net of the allowance for loan and lease losses, as of December 31, 2013 and 2012.
Table 12: Net Loans Held for Investment
December 31,
2013 2012
(Dollars in millions)
Total
Loans Held For
Investment Allowance
Net
Loans Held For
Investment
Total
Loans Held For
Investment Allowance
Net
Loans Held For
Investment
Credit Card ............ $ 81,305 $3,214 $ 78,091 $ 91,755 $3,979 $ 87,776
Consumer Banking ...... 70,762 752 70,010 75,127 711 74,416
Commercial Banking .... 45,011 338 44,673 38,820 433 38,387
Other ................. 121 11 110 187 33 154
Total ............. $197,199 $4,315 $192,884 $205,889 $5,156 $200,733
81