Capital One 2013 Annual Report Download - page 199
Download and view the complete annual report
Please find page 199 of the 2013 Capital One annual report below. You can navigate through the pages in the report by either clicking on the pages listed below, or by using the keyword search tool below to find specific information within the annual report.-
 1
1 -
2
-
3
-
4
-
5
-
6
-
7
-
8
-
9
-
10
-
11
-
12
-
13
-
14
-
15
-
16
-
17
-
18
-
19
-
20
-
21
-
22
-
23
-
24
-
25
-
26
-
27
-
28
-
29
-
30
-
31
-
32
-
33
-
34
-
35
-
36
-
37
-
38
-
39
-
40
-
41
-
42
-
43
-
44
-
45
-
46
-
47
-
48
-
49
-
50
-
51
-
52
-
53
-
54
-
55
-
56
-
57
-
58
-
59
-
60
-
61
-
62
-
63
-
64
-
65
-
66
-
67
-
68
-
69
-
70
-
71
-
72
-
73
-
74
-
75
-
76
-
77
-
78
-
79
-
80
-
81
-
82
-
83
-
84
-
85
-
86
-
87
-
88
-
89
-
90
-
91
-
92
-
93
-
94
-
95
-
96
-
97
-
98
-
99
-
100
-
101
-
102
-
103
-
104
-
105
-
106
-
107
-
108
-
109
-
110
-
111
-
112
-
113
-
114
-
115
-
116
-
117
-
118
-
119
-
120
-
121
-
122
-
123
-
124
-
125
-
126
-
127
-
128
-
129
-
130
-
131
-
132
-
133
-
134
-
135
-
136
-
137
-
138
-
139
-
140
-
141
-
142
-
143
-
144
-
145
-
146
-
147
-
148
-
149
-
150
-
151
-
152
-
153
-
154
-
155
-
156
-
157
-
158
-
159
-
160
-
161
-
162
-
163
-
164
-
165
-
166
-
167
-
168
-
169
-
170
-
171
-
172
-
173
-
174
-
175
-
176
-
177
-
178
-
179
-
180
-
181
-
182
-
183
-
184
-
185
-
186
-
187
-
188
-
 189
189 -
 190
190 -
 191
191 -
 192
192 -
 193
193 -
 194
194 -
 195
195 -
 196
196 -
 197
197 -
 198
198 -
 199
199 -
 200
200 -
 201
201 -
 202
202 -
 203
203 -
 204
204 -
 205
205 -
 206
206 -
 207
207 -
 208
208 -
 209
209 -
210
-
211
-
212
-
213
-
214
-
215
-
216
-
217
-
218
-
219
-
220
-
221
-
222
-
223
-
224
-
225
-
226
-
227
-
228
-
229
-
230
-
231
-
232
-
233
-
234
-
235
-
236
-
237
-
238
-
239
-
240
-
241
-
242
-
243
-
244
-
245
-
246
-
247
-
248
-
249
-
250
-
251
-
252
-
253
-
254
-
255
-
256
-
257
-
258
-
259
-
260
-
261
-
262
-
263
-
264
-
265
-
266
-
267
-
268
-
269
-
270
-
271
-
272
-
273
-
274
-
275
-
276
-
277
-
278
-
279
-
280
-
281
-
282
-
283
-
284
-
285
-
286
-
287
-
288
-
289
-
290
-
291
-
292
-
293
-
294
-
295
-
296
-
297
-
298
-
299
-
300
-
301
-
302
 |
 |

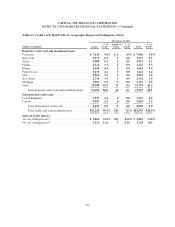
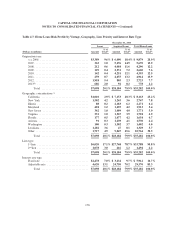
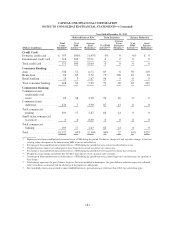
CAPITAL ONE FINANCIAL CORPORATION
NOTES TO CONSOLIDATED FINANCIAL STATEMENTS—(Continued)
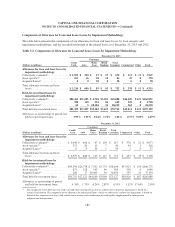
The following table presents the geographic distribution and internal risk ratings of our commercial loan
portfolio as of December 31, 2013 and 2012.
Table 4.8: Commercial Banking: Risk Profile by Geographic Region and Internal Risk Rating
December 31, 2013
(Dollars in millions)
Commercial
and
Multifamily
Real Estate
% of
Total(1)
Commercial
and
Industrial
% of
Total(1)
Small-ticket
Commercial
Real Estate
% of
Total(1)
Total
Commercial
% of
Total(1)
Geographic concentration:(2)
Loans:
Northeast .................... $14,543 70.1% $ 5,800 24.9% $582 61.3% $20,925 46.4%
Mid-Atlantic ................. 2,130 10.3 1,432 6.1 33 3.4 3,595 8.0
South ....................... 2,539 12.2 10,940 46.9 58 6.0 13,537 30.1
Other ....................... 1,454 7.0 4,959 21.3 279 29.3 6,692 14.9
Loans ....................... 20,666 99.6 23,131 99.2 952 100.0 44,749 99.4
Acquired Loans ............... 84 0.4 178 0.8 0 0.0 262 0.6
Total ........................ $20,750 100.0% $23,309 100.0% $952 100.0% $45,011 100.0%
Internal risk rating:(3)
Loans:
Noncriticized ................. $20,204 97.4% $22,448 96.3% $941 98.9% $43,593 96.9%
Criticized performing ........... 409 2.0 590 2.5 8 0.8 1,007 2.2
Criticized nonperforming ........ 53 0.2 93 0.4 3 0.3 149 0.3
Loans ....................... 20,666 99.6 23,131 99.2 952 100.0 44,749 99.4
Acquired Loans:
Noncriticized ................. 72 0.3 158 0.7 0 0.0 230 0.5
Criticized performing ........... 12 0.1 20 0.1 0 0.0 32 0.1
Total Acquired Loans .......... 84 0.4 178 0.8 0 0.0 262 0.6
Total ........................ $20,750 100.0% $23,309 100.0% $952 100.0% $45,011 100.0%
179