Capital One 2013 Annual Report Download - page 208
Download and view the complete annual report
Please find page 208 of the 2013 Capital One annual report below. You can navigate through the pages in the report by either clicking on the pages listed below, or by using the keyword search tool below to find specific information within the annual report.-
 1
1 -
2
-
3
-
4
-
5
-
6
-
7
-
8
-
9
-
10
-
11
-
12
-
13
-
14
-
15
-
16
-
17
-
18
-
19
-
20
-
21
-
22
-
23
-
24
-
25
-
26
-
27
-
28
-
29
-
30
-
31
-
32
-
33
-
34
-
35
-
36
-
37
-
38
-
39
-
40
-
41
-
42
-
43
-
44
-
45
-
46
-
47
-
48
-
49
-
50
-
51
-
52
-
53
-
54
-
55
-
56
-
57
-
58
-
59
-
60
-
61
-
62
-
63
-
64
-
65
-
66
-
67
-
68
-
69
-
70
-
71
-
72
-
73
-
74
-
75
-
76
-
77
-
78
-
79
-
80
-
81
-
82
-
83
-
84
-
85
-
86
-
87
-
88
-
89
-
90
-
91
-
92
-
93
-
94
-
95
-
96
-
97
-
98
-
99
-
100
-
101
-
102
-
103
-
104
-
105
-
106
-
107
-
108
-
109
-
110
-
111
-
112
-
113
-
114
-
115
-
116
-
117
-
118
-
119
-
120
-
121
-
122
-
123
-
124
-
125
-
126
-
127
-
128
-
129
-
130
-
131
-
132
-
133
-
134
-
135
-
136
-
137
-
138
-
139
-
140
-
141
-
142
-
143
-
144
-
145
-
146
-
147
-
148
-
149
-
150
-
151
-
152
-
153
-
154
-
155
-
156
-
157
-
158
-
159
-
160
-
161
-
162
-
163
-
164
-
165
-
166
-
167
-
168
-
169
-
170
-
171
-
172
-
173
-
174
-
175
-
176
-
177
-
178
-
179
-
180
-
181
-
182
-
183
-
184
-
185
-
186
-
187
-
188
-
189
-
190
-
191
-
192
-
193
-
194
-
195
-
196
-
197
-
 198
198 -
 199
199 -
 200
200 -
 201
201 -
 202
202 -
 203
203 -
 204
204 -
 205
205 -
 206
206 -
 207
207 -
 208
208 -
 209
209 -
 210
210 -
 211
211 -
 212
212 -
 213
213 -
 214
214 -
 215
215 -
 216
216 -
 217
217 -
 218
218 -
219
-
220
-
221
-
222
-
223
-
224
-
225
-
226
-
227
-
228
-
229
-
230
-
231
-
232
-
233
-
234
-
235
-
236
-
237
-
238
-
239
-
240
-
241
-
242
-
243
-
244
-
245
-
246
-
247
-
248
-
249
-
250
-
251
-
252
-
253
-
254
-
255
-
256
-
257
-
258
-
259
-
260
-
261
-
262
-
263
-
264
-
265
-
266
-
267
-
268
-
269
-
270
-
271
-
272
-
273
-
274
-
275
-
276
-
277
-
278
-
279
-
280
-
281
-
282
-
283
-
284
-
285
-
286
-
287
-
288
-
289
-
290
-
291
-
292
-
293
-
294
-
295
-
296
-
297
-
298
-
299
-
300
-
301
-
302
 |
 |

CAPITAL ONE FINANCIAL CORPORATION
NOTES TO CONSOLIDATED FINANCIAL STATEMENTS—(Continued)
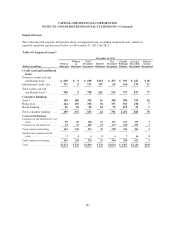
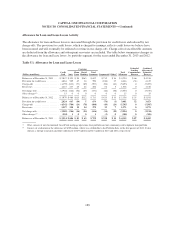
Allowance for Loan and Lease Losses Activity
The allowance for loan and lease losses is increased through the provision for credit losses and reduced by net
charge-offs. The provision for credit losses, which is charged to earnings, reflects credit losses we believe have
been incurred and will eventually be reflected over time in our charge-offs. Charge-offs of uncollectible amounts
are deducted from the allowance and subsequent recoveries are included. The table below summarizes changes in
the allowance for loan and lease losses, by portfolio segment, for the years ended December 31, 2013 and 2012:
Table 5.1: Allowance for Loan and Lease Losses
Consumer Unfunded
Lending
Commitments
Reserve
Combined
Allowance &
Unfunded
Reserve(Dollars in millions)
Credit
Card Auto
Home
Loan
Retail
Banking
Total
Consumer Commercial Other(1)
Total
Allowance
Balance as of December 31, 2011 .... $2,847 $ 391 $ 98 $163 $ 652 $ 715 $ 36 $ 4,250 $ 66 $ 4,316
Provision for credit losses .......... 4,061 509 67 14 590 (240) 35 4,446 (31) 4,415
Charge-offs ..................... (4,159) (631) (77) (89) (797) (94) (43) (5,093) 0 (5,093)
Recoveries ...................... 1,215 217 25 24 266 52 5 1,538 0 1,538
Net charge-offs ................... (2,944) (414) (52) (65) (531) (42) (38) (3,555) 0 (3,555)
Other changes(2) .................. 15 0 0 0 0 0 0 15 0 15
Balance as of December 31, 2012 .... $3,979 $ 486 $113 $112 $ 711 $ 433 $ 33 $ 5,156 $ 35 $ 5,191
Provision for credit losses .......... 2,824 665 (14) 5 656 (76) (3) 3,401 52 3,453
Charge-offs ..................... (4,542) (784) (26) (78) (888) (49) (26) (5,505) 0 (5,505)
Recoveries ...................... 1,257 238 10 24 272 35 7 1,571 0 1,571
Net charge-offs ................... (3,285) (546) (16) (54) (616) (14) (19) (3,934) 0 (3,934)
Other changes(2) .................. (304) 1 0 0 1 (5) 0 (308) 0 (308)
Balance as of December 31, 2013 .... $ 3,214 $ 606 $ 83 $ 63 $ 752 $ 338 $ 11 $ 4,315 $ 87 $ 4,402
(1) Other consists of our discontinued GreenPoint mortgage operations loan portfolio and our community redevelopment loan portfolio.
(2) Consists of a reduction in the allowance of $289 million, which was attributable to the Portfolio Sale, in the first quarter of 2013. It also
contains a foreign translation and other adjustment of $19 million and $15 million in 2013 and 2012, respectively.
188