Capital One 2013 Annual Report Download - page 94
Download and view the complete annual report
Please find page 94 of the 2013 Capital One annual report below. You can navigate through the pages in the report by either clicking on the pages listed below, or by using the keyword search tool below to find specific information within the annual report.-
 1
1 -
2
-
3
-
4
-
5
-
6
-
7
-
8
-
9
-
10
-
11
-
12
-
13
-
14
-
15
-
16
-
17
-
18
-
19
-
20
-
21
-
22
-
23
-
24
-
25
-
26
-
27
-
28
-
29
-
30
-
31
-
32
-
33
-
34
-
35
-
36
-
37
-
38
-
39
-
40
-
41
-
42
-
43
-
44
-
45
-
46
-
47
-
48
-
49
-
50
-
51
-
52
-
53
-
54
-
55
-
56
-
57
-
58
-
59
-
60
-
61
-
62
-
63
-
64
-
65
-
66
-
67
-
68
-
69
-
70
-
71
-
72
-
73
-
74
-
75
-
76
-
77
-
78
-
79
-
80
-
81
-
82
-
83
-
 84
84 -
 85
85 -
 86
86 -
 87
87 -
 88
88 -
 89
89 -
 90
90 -
 91
91 -
 92
92 -
 93
93 -
 94
94 -
 95
95 -
 96
96 -
 97
97 -
 98
98 -
 99
99 -
 100
100 -
 101
101 -
 102
102 -
 103
103 -
 104
104 -
105
-
106
-
107
-
108
-
109
-
110
-
111
-
112
-
113
-
114
-
115
-
116
-
117
-
118
-
119
-
120
-
121
-
122
-
123
-
124
-
125
-
126
-
127
-
128
-
129
-
130
-
131
-
132
-
133
-
134
-
135
-
136
-
137
-
138
-
139
-
140
-
141
-
142
-
143
-
144
-
145
-
146
-
147
-
148
-
149
-
150
-
151
-
152
-
153
-
154
-
155
-
156
-
157
-
158
-
159
-
160
-
161
-
162
-
163
-
164
-
165
-
166
-
167
-
168
-
169
-
170
-
171
-
172
-
173
-
174
-
175
-
176
-
177
-
178
-
179
-
180
-
181
-
182
-
183
-
184
-
185
-
186
-
187
-
188
-
189
-
190
-
191
-
192
-
193
-
194
-
195
-
196
-
197
-
198
-
199
-
200
-
201
-
202
-
203
-
204
-
205
-
206
-
207
-
208
-
209
-
210
-
211
-
212
-
213
-
214
-
215
-
216
-
217
-
218
-
219
-
220
-
221
-
222
-
223
-
224
-
225
-
226
-
227
-
228
-
229
-
230
-
231
-
232
-
233
-
234
-
235
-
236
-
237
-
238
-
239
-
240
-
241
-
242
-
243
-
244
-
245
-
246
-
247
-
248
-
249
-
250
-
251
-
252
-
253
-
254
-
255
-
256
-
257
-
258
-
259
-
260
-
261
-
262
-
263
-
264
-
265
-
266
-
267
-
268
-
269
-
270
-
271
-
272
-
273
-
274
-
275
-
276
-
277
-
278
-
279
-
280
-
281
-
282
-
283
-
284
-
285
-
286
-
287
-
288
-
289
-
290
-
291
-
292
-
293
-
294
-
295
-
296
-
297
-
298
-
299
-
300
-
301
-
302
 |
 |
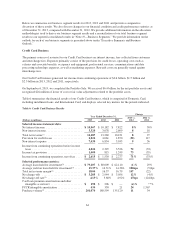
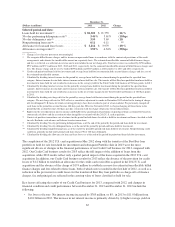
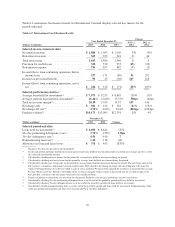
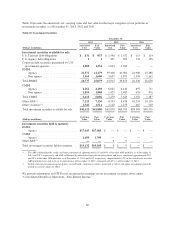
•Loans Held for Investment: Period-end loans held for investment in our Consumer Banking business
declined by $4.4 billion, or 6%, in 2013, to $70.8 billion as of December 31, 2013, due to the continued
expected run-off of acquired home loans, partially offset by higher period-end auto loan balances due to the
continued high volume of auto loan originations.
•Deposits: Period-end deposits in our Consumer Banking business declined by $4.7 billion, or 3%, in 2013 to
$167.7 billion as of December 31, 2013, primarily due to the expected run-off of our legacy National Direct
Bank deposits.
•Charge-off and Delinquency Statistics: The reported net charge-off rate increased to 0.85% in 2013, from
0.74% in 2012. The 30+ day delinquency rate increased to 3.89% as of December 31, 2013, from 3.34% as
of December 31, 2012. The increase in the net charge-off rates reflect moderately higher auto loan charge-
offs, partially offset by improved home loan performance. The overall delinquency rates increased
moderately largely due to the run-off of the acquired home loans, which were included in the denominator
in calculating the delinquency rates.
Key factors affecting the results of our Consumer Banking business for 2012, compared with 2011, and changes
in financial condition and credit performance between December 31, 2012 and December 31, 2011 include the
following:
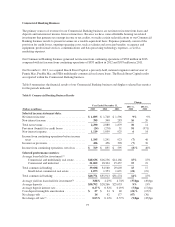
•Net Interest Income: Net interest income increased by $1.6 billion, or 37%, in 2012. The increase was
primarily attributable to the addition of home loans from the ING Direct acquisition, continued growth and
strong margin performance in our auto loan portfolio and the addition of low-rate deposits from the ING
Direct acquisition. With the addition of deposits from ING Direct, average deposits increased to $162.6
billion in 2012, from $86.9 billion in 2011, while the average deposit interest rate fell to 0.70% in 2012,
from 0.96% in 2011. The favorable impact from these items was modestly offset by the expected run-off of
acquired home loans.
•Non-Interest Income: Non-interest income increased by $62 million, or 9%, in 2012. The increase was
primarily attributable to mark-to-market gains on retained interests in interest-only strips and negative
amortization mortgage securities recognized in the third quarter of 2012.
•Provision for Credit Losses: The provision for credit losses increased by $137 million in 2012 to
$589 million. The increase was largely due to higher auto loan balances, which more than offset the benefit
from lower net charge-off rates and continued credit performance improvement. We recorded an allowance
build of $59 million in 2012, compared with an allowance release of $23 million in 2011.
•Non-Interest Expense: Non-interest expense increased by $627 million, or 19%, in 2012. The increase was
largely attributable to operating expenses related to ING Direct, merger-related expenses associated with the
acquisition and higher infrastructure expenditures resulting from continued investments in the home loan
business and growth in auto loan balances as a result of increased auto loan originations.
•Loans Held for Investment: Period-end loans in the Consumer Banking business increased by $38.8 billion,
or 107%, in 2012 to $75.1 billion as of December 31, 2012, primarily due to the acquisition of $40.4 billion
of ING Direct home loans and growth in auto loan originations, which were partially offset by the expected
continued run-off of our acquired home loan portfolios.
•Deposits: Period-end deposits in the Consumer Banking business increased by $83.9 billion, or 95%, in
2012 to $172.4 billion as of December 31, 2012, primarily due to the addition of ING Direct deposits of
$84.4 billion.
•Charge-off and Delinquency Statistics: The net charge-off rate decreased to 0.74% in 2012, from 1.39% in
2011. The 30+ day delinquency rate decreased to 3.34% as of December 31, 2012, from 5.99% as of
December 31, 2011. The improvement in our reported net charge-off and delinquency rates for our
Consumer Banking business reflects the impact of the addition of the ING Direct home loan portfolio. The
overall improvement in credit quality metrics, excluding Acquired Loans, reflects improved credit
performance in our legacy consumer loan portfolios.
74