Capital One 2013 Annual Report Download - page 297
Download and view the complete annual report
Please find page 297 of the 2013 Capital One annual report below. You can navigate through the pages in the report by either clicking on the pages listed below, or by using the keyword search tool below to find specific information within the annual report.-
 1
1 -
2
-
3
-
4
-
5
-
6
-
7
-
8
-
9
-
10
-
11
-
12
-
13
-
14
-
15
-
16
-
17
-
18
-
19
-
20
-
21
-
22
-
23
-
24
-
25
-
26
-
27
-
28
-
29
-
30
-
31
-
32
-
33
-
34
-
35
-
36
-
37
-
38
-
39
-
40
-
41
-
42
-
43
-
44
-
45
-
46
-
47
-
48
-
49
-
50
-
51
-
52
-
53
-
54
-
55
-
56
-
57
-
58
-
59
-
60
-
61
-
62
-
63
-
64
-
65
-
66
-
67
-
68
-
69
-
70
-
71
-
72
-
73
-
74
-
75
-
76
-
77
-
78
-
79
-
80
-
81
-
82
-
83
-
84
-
85
-
86
-
87
-
88
-
89
-
90
-
91
-
92
-
93
-
94
-
95
-
96
-
97
-
98
-
99
-
100
-
101
-
102
-
103
-
104
-
105
-
106
-
107
-
108
-
109
-
110
-
111
-
112
-
113
-
114
-
115
-
116
-
117
-
118
-
119
-
120
-
121
-
122
-
123
-
124
-
125
-
126
-
127
-
128
-
129
-
130
-
131
-
132
-
133
-
134
-
135
-
136
-
137
-
138
-
139
-
140
-
141
-
142
-
143
-
144
-
145
-
146
-
147
-
148
-
149
-
150
-
151
-
152
-
153
-
154
-
155
-
156
-
157
-
158
-
159
-
160
-
161
-
162
-
163
-
164
-
165
-
166
-
167
-
168
-
169
-
170
-
171
-
172
-
173
-
174
-
175
-
176
-
177
-
178
-
179
-
180
-
181
-
182
-
183
-
184
-
185
-
186
-
187
-
188
-
189
-
190
-
191
-
192
-
193
-
194
-
195
-
196
-
197
-
198
-
199
-
200
-
201
-
202
-
203
-
204
-
205
-
206
-
207
-
208
-
209
-
210
-
211
-
212
-
213
-
214
-
215
-
216
-
217
-
218
-
219
-
220
-
221
-
222
-
223
-
224
-
225
-
226
-
227
-
228
-
229
-
230
-
231
-
232
-
233
-
234
-
235
-
236
-
237
-
238
-
239
-
240
-
241
-
242
-
243
-
244
-
245
-
246
-
247
-
248
-
249
-
250
-
251
-
252
-
253
-
254
-
255
-
256
-
257
-
258
-
259
-
260
-
261
-
262
-
263
-
264
-
265
-
266
-
267
-
268
-
269
-
270
-
271
-
272
-
273
-
274
-
275
-
276
-
277
-
278
-
279
-
280
-
281
-
282
-
283
-
284
-
285
-
286
-
 287
287 -
 288
288 -
 289
289 -
 290
290 -
 291
291 -
 292
292 -
 293
293 -
 294
294 -
 295
295 -
 296
296 -
 297
297 -
 298
298 -
 299
299 -
 300
300 -
 301
301 -
 302
302
 |
 |

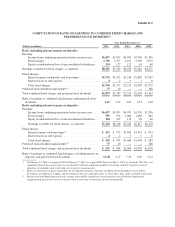
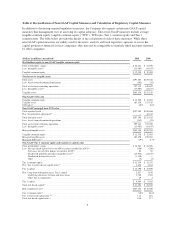
Table 3: Reconciliation of Non-GAAP Average Balances, Net Interest Income and Net Interest Margin
Year Ended December 31,
2010 2009
(Dollars in millions) (unaudited)
Average
Balance
Interest
Income/
Expense
Yield/
Rate
Average
Balance
Interest
Income/
Expense
Yield/
Rate
Reported basis
Interest-earning assets:
Loans held for investment .................. $168,015 $15,276 9.09% $136,697 $10,367 7.58%
Other ................................... 7,668 77 1.00 8,855 297 3.35
Total interest-earning assets ..................... 175,683 15,353 8.74 145,552 10,664 7.33
Interest-bearing liabilities:
Securitization liability ..................... 34,185 809 2.37 5,516 282 5.11
Total interest-bearing liabilities .................. 154,363 2,896 1.88 126,600 2,967 2.34
Net interest income/spread ...................... $12,457 6.86% $ 7,697 4.99%
Interest income to average interest-earning assets .... 8.74% 7.33%
Interest expense to average interest-earning assets . . . 1.65 2.04
Net interest margin ............................ 7.09% 5.29%
Non-GAAP securitization reconciliation adjustments
Interest-earning assets:
Loans held for investment .................. $ 96 $ 8 —%$ 43,727 $ 5,678 1.31%
Other ................................... (22) — (0.01) (3,061) (229) (2.23)
Total interest-earning assets ..................... 74 8 — 40,666 5,449 1.32
Interest-bearing liabilities:
Securitization liability ..................... 79 4 — 41,100 1,057 (2.24)
Net interest income/spread ...................... $ 4 —% $ 4,392 1.26%
Interest income to average interest-earning assets .... —% 1.32%
Interest expense to average interest-earning assets . . . — 0.12
Net interest margin ............................ —% 1.20%
Non-GAAP managed basis
Interest-earning assets:
Loans held for investment .................. $168,111 $15,284 9.09% $180,424 $16,045 8.89%
Other ................................... 7,646 77 1.01 5,794 68 1.17
Total interest-earning assets ..................... 175,757 15,361 8.74 186,218 16,113 8.65
Interest-bearing liabilities:
Securitization liability ..................... 34,264 813 2.37 46,616 1,339 2.87
Total interest-bearing liabilities .................. 154,443 2,900 1.88 167,700 4,024 2.40
Net interest income/spread ...................... $12,461 6.86% $12,089 6.25%
Interest income to average interest-earning assets .... 8.74% 8.65%
Interest expense to average interest-earning assets . . . 1.65 2.16
Net interest margin ............................ 7.09% 6.49%
4