Capital One 2013 Annual Report Download - page 91
Download and view the complete annual report
Please find page 91 of the 2013 Capital One annual report below. You can navigate through the pages in the report by either clicking on the pages listed below, or by using the keyword search tool below to find specific information within the annual report.-
 1
1 -
2
-
3
-
4
-
5
-
6
-
7
-
8
-
9
-
10
-
11
-
12
-
13
-
14
-
15
-
16
-
17
-
18
-
19
-
20
-
21
-
22
-
23
-
24
-
25
-
26
-
27
-
28
-
29
-
30
-
31
-
32
-
33
-
34
-
35
-
36
-
37
-
38
-
39
-
40
-
41
-
42
-
43
-
44
-
45
-
46
-
47
-
48
-
49
-
50
-
51
-
52
-
53
-
54
-
55
-
56
-
57
-
58
-
59
-
60
-
61
-
62
-
63
-
64
-
65
-
66
-
67
-
68
-
69
-
70
-
71
-
72
-
73
-
74
-
75
-
76
-
77
-
78
-
79
-
80
-
 81
81 -
 82
82 -
 83
83 -
 84
84 -
 85
85 -
 86
86 -
 87
87 -
 88
88 -
 89
89 -
 90
90 -
 91
91 -
 92
92 -
 93
93 -
 94
94 -
 95
95 -
 96
96 -
 97
97 -
 98
98 -
 99
99 -
 100
100 -
 101
101 -
102
-
103
-
104
-
105
-
106
-
107
-
108
-
109
-
110
-
111
-
112
-
113
-
114
-
115
-
116
-
117
-
118
-
119
-
120
-
121
-
122
-
123
-
124
-
125
-
126
-
127
-
128
-
129
-
130
-
131
-
132
-
133
-
134
-
135
-
136
-
137
-
138
-
139
-
140
-
141
-
142
-
143
-
144
-
145
-
146
-
147
-
148
-
149
-
150
-
151
-
152
-
153
-
154
-
155
-
156
-
157
-
158
-
159
-
160
-
161
-
162
-
163
-
164
-
165
-
166
-
167
-
168
-
169
-
170
-
171
-
172
-
173
-
174
-
175
-
176
-
177
-
178
-
179
-
180
-
181
-
182
-
183
-
184
-
185
-
186
-
187
-
188
-
189
-
190
-
191
-
192
-
193
-
194
-
195
-
196
-
197
-
198
-
199
-
200
-
201
-
202
-
203
-
204
-
205
-
206
-
207
-
208
-
209
-
210
-
211
-
212
-
213
-
214
-
215
-
216
-
217
-
218
-
219
-
220
-
221
-
222
-
223
-
224
-
225
-
226
-
227
-
228
-
229
-
230
-
231
-
232
-
233
-
234
-
235
-
236
-
237
-
238
-
239
-
240
-
241
-
242
-
243
-
244
-
245
-
246
-
247
-
248
-
249
-
250
-
251
-
252
-
253
-
254
-
255
-
256
-
257
-
258
-
259
-
260
-
261
-
262
-
263
-
264
-
265
-
266
-
267
-
268
-
269
-
270
-
271
-
272
-
273
-
274
-
275
-
276
-
277
-
278
-
279
-
280
-
281
-
282
-
283
-
284
-
285
-
286
-
287
-
288
-
289
-
290
-
291
-
292
-
293
-
294
-
295
-
296
-
297
-
298
-
299
-
300
-
301
-
302
 |
 |
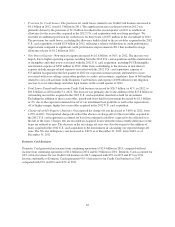
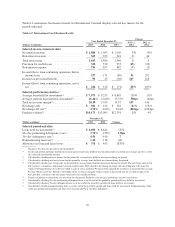
Our International Card business generated net income from continuing operations of $234 million in 2013,
compared with net income from continuing operations of $126 million in 2012. The primary drivers of the
improvement in results for our International Card business in 2013, compared with 2012 included: (i) the absence
of charges recorded in the second quarter of 2012 associated with refunds to U.K. customers due to retrospective
regulatory requirements pertaining to Payment Protection Insurance, which had an unfavorable impact on total
net revenue and non-interest expense in 2012, and (ii) a reduction in the provision for credit losses attributable to
lower net charge-offs, reflecting the improvement in the credit environment in Canada and the U.K.
Our International Card business generated net income from continuing operations of $126 million in 2012,
compared with a net loss from continuing operations of $51 million in 2011. The International Card net income
in 2012, compared with net loss in 2011, was driven by a decrease in the provision for credit losses, attributable
to lower net charge-offs resulting from credit improvement in Canada and the U.K., and the absence of an
allowance build of $105 million for the Hudson Bay Corporation loan portfolio we acquired in January 2011.
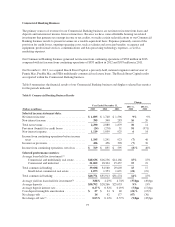
Consumer Banking Business
The primary sources of revenue for our Consumer Banking business are net interest income from loans and
deposits and non-interest income from customer fees. Expenses primarily consist of the provision for credit
losses, ongoing operating costs, such as salaries and associate benefits, occupancy and equipment, professional
services, communications and data processing technology expenses, as well as marketing expenses.
Our Consumer Banking business generated net income from continuing operations of $1.5 billion in 2013,
compared with net income from continuing operations of $1.4 billion in 2012 and $809 million in 2011. Our
results primarily reflect an increase in average balances in our auto portfolio offset by lower yields. This was
partially offset by declining average balances and yields in our home loan portfolio.
On February 17, 2012, we acquired ING Direct, which resulted in the addition of loans with carrying value of
$40.4 billion and deposits of $84.4 billion at acquisition. The substantial majority of the lending and retail
deposit businesses acquired are reported in our Consumer Banking business; however, the results of our
Consumer Banking business for the first quarter of 2012 reflect only a partial-quarter impact from the operations
of ING Direct.
71