Capital One 2009 Annual Report Download - page 99
Download and view the complete annual report
Please find page 99 of the 2009 Capital One annual report below. You can navigate through the pages in the report by either clicking on the pages listed below, or by using the keyword search tool below to find specific information within the annual report.-
 1
1 -
2
-
3
-
4
-
5
-
6
-
7
-
8
-
9
-
10
-
11
-
12
-
13
-
14
-
15
-
16
-
17
-
18
-
19
-
20
-
21
-
22
-
23
-
24
-
25
-
26
-
27
-
28
-
29
-
30
-
31
-
32
-
33
-
34
-
35
-
36
-
37
-
38
-
39
-
40
-
41
-
42
-
43
-
44
-
45
-
46
-
47
-
48
-
49
-
50
-
51
-
52
-
53
-
54
-
55
-
56
-
57
-
58
-
59
-
60
-
61
-
62
-
63
-
64
-
65
-
66
-
67
-
68
-
69
-
70
-
71
-
72
-
73
-
74
-
75
-
76
-
77
-
78
-
79
-
80
-
81
-
82
-
83
-
84
-
85
-
86
-
87
-
88
-
 89
89 -
 90
90 -
 91
91 -
 92
92 -
 93
93 -
 94
94 -
 95
95 -
 96
96 -
 97
97 -
 98
98 -
 99
99 -
 100
100 -
 101
101 -
 102
102 -
 103
103 -
 104
104 -
 105
105 -
 106
106 -
 107
107 -
 108
108 -
 109
109 -
110
-
111
-
112
-
113
-
114
-
115
-
116
-
117
-
118
-
119
-
120
-
121
-
122
-
123
-
124
-
125
-
126
-
127
-
128
-
129
-
130
-
131
-
132
-
133
-
134
-
135
-
136
-
137
-
138
-
139
-
140
-
141
-
142
-
143
-
144
-
145
-
146
-
147
-
148
-
149
-
150
-
151
-
152
-
153
-
154
-
155
-
156
-
157
-
158
-
159
-
160
-
161
-
162
-
163
-
164
-
165
-
166
-
167
-
168
-
169
-
170
-
171
-
172
-
173
-
174
-
175
-
176
-
177
-
178
-
179
-
180
-
181
-
182
-
183
-
184
-
185
-
186
-
187
-
188
-
189
-
190
-
191
-
192
-
193
-
194
-
195
-
196
-
197
-
198
-
199
-
200
-
201
-
202
-
203
-
204
-
205
-
206
-
207
-
208
-
209
 |
 |

86
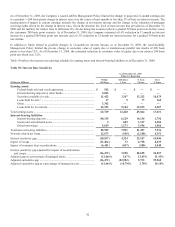
XI. Tabular Summary
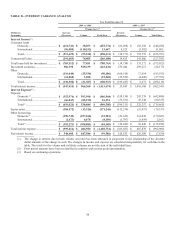
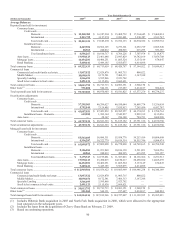
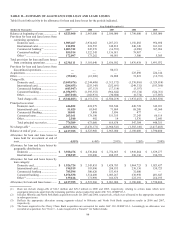
TABLE A—STATEMENTS OF AVERAGE BALANCES, INCOME AND EXPENSE, YIELDS AND RATES
Table A provides average balance sheet data and an analysis of net interest income, net interest spread (the difference between the yield on earning assets and the cost of interest-
bearing liabilities) and net interest margin for the years ended December 31, 2009, 2008 and 2007.
Year Ended December 31
2009 2008(2) 2007(2)
(Dollars in Thousands)
Average
Balance Income/
Expense Yield/
Rate Average
Balance
Income/
Expense Yield/
Rate Average
Balance Income/
Expense Yield/
Rate
Assets:
Earning assets
Consumer loans
(
1
)
..................................................
.
Domestic ......................................................
.
$ 67,160,791 $ 6,889,210 10.26% $ 66,811,204 $ 7,303,951 10.93% $ 65,164,148 $ 7,366,449 11.30%
International.................................................
.
2,612,702 347,803 13.31% 3,445,986 444,691 12.90% 3,474,326 436,368 12.56%
Total consumer loans ...................................
.
$ 69,773,493 $ 7,237,013 10.37% $ 70,257,190 $ 7,748,642 11.03% $ 68,638,474 $ 7,802,817 11.37%
Commercial loans ..................................................
.
30,013,792 1,520,053 5.06% 28,713,713 1,711,736 5.96% 24,903,351 1,697,311 6.82%
Total loans held for investment ..............................
.
$ 99,787,285 $ 8,757,066 8.78% $ 98,970,903 $ 9,460,378 9.56% $ 93,541,825 $ 9,500,128 10.16%
Investment securities ..............................................
.
36,909,873 1,610,210 4.36% 25,042,506 1,224,012 4.89% 18,933,750 950,972 5.02%
Other ......................................................................
.
Domestic ................................................................
.
7,489,350 290,200 3.87% 8,030,295 406,240 5.06% 7,792,357 573,158 7.36%
International ...........................................................
.
1,106,501 7,109 0.64% 1,039,940 21,369 2.05% 1,152,497 53,898 4.68%
Total ............................................................
.
$ 8,595,851 $ 297,309 3.46% $ 9,070,235 $ 427,609 4.71% $ 8,944,854 $ 627,056 7.01%
Total earning assets
(
3
)
......................................................
.
$ 145,293,009 $ 10,664,585 7.34% $ 133,083,644 $ 11,111,999 8.35% $ 121,420,429 $ 11,078,156 9.12%
Cash and due from banks
(
3
)
..............................................
.
3,475,932 2,127,961 2,112,587
Allowance for loan and lease losses
(
3
)
.............................
.
(4,470,247 ) (3,266,768) (2,182,667)
Premises and equipment, net
(
3
)
........................................
.
2,718,297 2,317,383 2,250,117
Other
(
3
)
.............................................................................
.
24,556,589 21,964,147 21,398,626
Total assets from discontinued operations ........................
.
24,033 65,161 3,984,100
Total assets .......................................................................
.
$ 171,597,613 $ 156,291,528 $ 148,983,192
Liabilities and Equity:
Interest-bearing liabilities
Deposits .................................................................
.
Domestic ......................................................
.
$ 102,337,209 $ 2,069,558 2.02% $ 79,293,788 $ 2,422,532 3.06% $ 71,447,121 $ 2,781,662 3.89%
International.................................................
.
740,999 23,461 3.17% 3,441,839 89,508 2.60% 2,317,790 124,689 5.38%
Total deposits ..............................................
.
$ 103,078,208 $ 2,093,019 2.03% $ 82,735,627 $ 2,512,040 3.04% $ 73,764,911 $ 2,906,351 3.94%
Senior and subordinated notes................................
.
8,607,599 260,282 3.02% 8,881,491 444,854 5.01% 9,840,074 577,128 5.87%
Other borrowings ...................................................
.
Domestic ......................................................
.
$ 13,455,842 $ 603,152 4.48% $ 21,399,280 $ 993,901 4.64% $ 19,171,300 $ 1,050,546 5.48%
International.................................................
.
1,441,489 11,017 0.76% 815,706 12,489 1.53% 1,090,149 14,286 1.31%
Total other borrowings ................................
.
$ 14,897,331 $ 614,169 4.12% $ 22,214,986 $ 1,006,390 4.53% $ 20,261,449 $ 1,064,832 5.26%
Total interest-bearing liabilities
(
3
)
....................................
.
$ 126,583,138 $ 2,967,470 2.34% $ 113,832,104 $ 3,963,284 3.48% $ 103,866,434 $ 4,548,311 4.38%
N
on-interest bearing deposits
(
3
)
.......................................
.
12,522,536 10,772,019 11,446,706
Other
(
3
)
.............................................................................
.
5,737,178 6,261,090 5,349,568