Capital One 2009 Annual Report Download - page 145
Download and view the complete annual report
Please find page 145 of the 2009 Capital One annual report below. You can navigate through the pages in the report by either clicking on the pages listed below, or by using the keyword search tool below to find specific information within the annual report.-
 1
1 -
2
-
3
-
4
-
5
-
6
-
7
-
8
-
9
-
10
-
11
-
12
-
13
-
14
-
15
-
16
-
17
-
18
-
19
-
20
-
21
-
22
-
23
-
24
-
25
-
26
-
27
-
28
-
29
-
30
-
31
-
32
-
33
-
34
-
35
-
36
-
37
-
38
-
39
-
40
-
41
-
42
-
43
-
44
-
45
-
46
-
47
-
48
-
49
-
50
-
51
-
52
-
53
-
54
-
55
-
56
-
57
-
58
-
59
-
60
-
61
-
62
-
63
-
64
-
65
-
66
-
67
-
68
-
69
-
70
-
71
-
72
-
73
-
74
-
75
-
76
-
77
-
78
-
79
-
80
-
81
-
82
-
83
-
84
-
85
-
86
-
87
-
88
-
89
-
90
-
91
-
92
-
93
-
94
-
95
-
96
-
97
-
98
-
99
-
100
-
101
-
102
-
103
-
104
-
105
-
106
-
107
-
108
-
109
-
110
-
111
-
112
-
113
-
114
-
115
-
116
-
117
-
118
-
119
-
120
-
121
-
122
-
123
-
124
-
125
-
126
-
127
-
128
-
129
-
130
-
131
-
132
-
133
-
134
-
 135
135 -
 136
136 -
 137
137 -
 138
138 -
 139
139 -
 140
140 -
 141
141 -
 142
142 -
 143
143 -
 144
144 -
 145
145 -
 146
146 -
 147
147 -
 148
148 -
 149
149 -
 150
150 -
 151
151 -
 152
152 -
 153
153 -
 154
154 -
 155
155 -
156
-
157
-
158
-
159
-
160
-
161
-
162
-
163
-
164
-
165
-
166
-
167
-
168
-
169
-
170
-
171
-
172
-
173
-
174
-
175
-
176
-
177
-
178
-
179
-
180
-
181
-
182
-
183
-
184
-
185
-
186
-
187
-
188
-
189
-
190
-
191
-
192
-
193
-
194
-
195
-
196
-
197
-
198
-
199
-
200
-
201
-
202
-
203
-
204
-
205
-
206
-
207
-
208
-
209
 |
 |

132
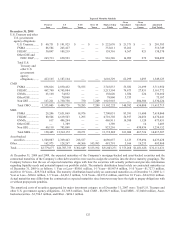
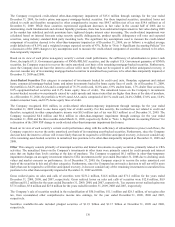
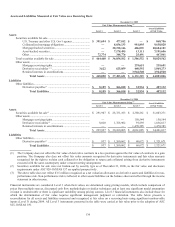
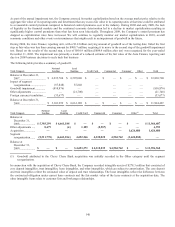
The Company’s acquired loans from the Chevy Chase Bank acquisition are initially recorded at fair value and no separate allowance
for loan and lease losses is recorded for these loans as long as the loans perform as initially expected. Charge-offs of $373.8 million
were applied against the non-accretable difference established at acquisition. See “Note 3- Loans Acquired in a Transfer” for a more
detailed discussion.
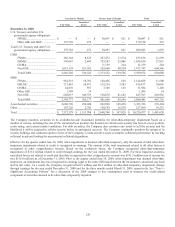
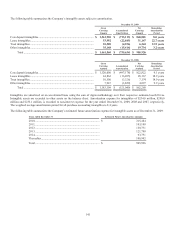
Unfunded Lending Commitments
We manage the potential risk in credit commitments by limiting the total amount of arrangements, both by individual customer and in
total, by monitoring the size and maturity structure of these portfolios and by applying the same credit standards for all of our credit
activities.
As of December 31, 2009 and 2008, the Company had $154.9 billion and $171.1 billion, respectively, of unused credit card lines.
While this amount represented the total unused available credit card lines, the Company has not experienced, and does not anticipate,
that all of its customers will exercise their entire available line at any given point in time.
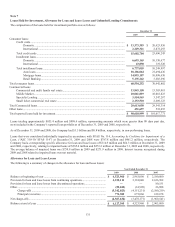
In addition to available unused credit card lines, the Company enters into commitments to extend credit that are legally binding
conditional agreements having fixed expirations or termination dates and specified interest rates and purposes. These commitments
generally require customers to maintain certain credit standards. Collateral requirements and loan-to-value ratios are the same as those
for funded transactions and are established based on management’s credit assessment of the customer. Commitments may expire
without being drawn upon. Therefore, the total commitment amount does not necessarily represent future requirements. The Company
maintains a reserve for unfunded loan commitments and letters of credit to absorb estimated probable losses related to these unfunded
credit facilities in other liabilities. The outstanding unfunded commitments to extend credit other than credit card lines were
approximately $12.0 billion and $10.0 billion as of December 31, 2009 and 2008, respectively. A reserve of $118.6 million and $26.0
million has been established as of December 31, 2009 and 2008, respectively.
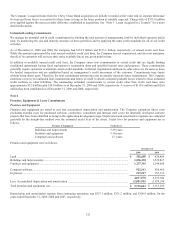
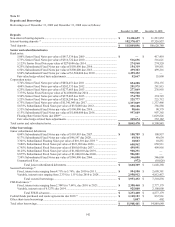
Note 8
Premises, Equipment & Lease Commitments
Premises and Equipment
Premises and equipment are stated at cost less accumulated depreciation and amortization. The Company capitalizes direct costs
(including external costs for purchased software, contractors, consultants and internal staff costs) for internally developed software
projects that have been identified as being in the application development stage. Depreciation and amortization expenses are computed
generally by the straight-line method over the estimated useful lives of the assets. Useful lives for premises and equipment are as
follows:
Premises & Equipment
Useful Lives
Buildings and improvement 5-39 years
Furniture and equipment 3-10 years
Computers and software 3-7 years
Premises and equipment were as follows:
December 31
2009
2008
Land ..........................................................................................................................................................
.
$ 582,685 $ 424,409
Buildings and improvements ....................................................................................................................
.
1,836,218 1,529,827
Furniture and equipment ...........................................................................................................................
.
1,237,315 1,144,606
Computer software ....................................................................................................................................
.
922,143 836,465
In process ..................................................................................................................................................
.
239,217 257,333
4,817,578 4,192,640
Less: Accumulated depreciation and amortization ...................................................................................
.
(2,081,955 (1,879,534
)
Total premises and equipment, net ...........................................................................................................
.
$ 2,735,623 $ 2,313,106
Depreciation and amortization expense from continuing operations was $327.1 million, $331.2 million, and $308.8 million, for the
years ended December 31, 2009, 2008 and 2007, respectively.