Capital One 2009 Annual Report Download - page 114
Download and view the complete annual report
Please find page 114 of the 2009 Capital One annual report below. You can navigate through the pages in the report by either clicking on the pages listed below, or by using the keyword search tool below to find specific information within the annual report.
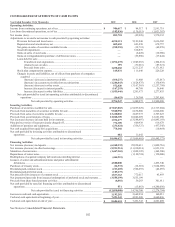
101
Common Stock
Preferred Stock
Paid-In Capital,
Net
Retained
Earnings
Accumulated Other
Comprehensive
Income (Loss) Treasury
Stock
Total
Stockholders’
Equity
(In Thousands, Except Per Share Data)
Shares Amount
Accretion of preferred stock discount ..............................................................
.
— — 10,009 — (10,009) — — —
Compensation expense for restricted stock awards and stock options ............
.
— — — 95,048 — — — 95,048
Allocation of ESOP shares ...............................................................................
.
— — — 4,678 — — — 4,678
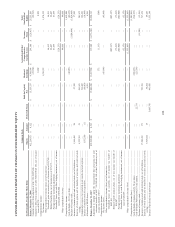
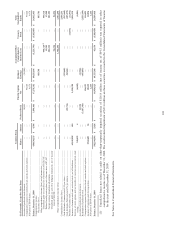
Balance, December 31, 2008 438,434,235 $ 4,384 $ 3,096,466 $ 17,278,102 $ 10,621,164 $ (1,221,796) $ (3,165,887) $ 26,612,433
Comprehensive income:
Net income (loss) .......................................................................................
.
— — — — 883,781 — — 883,781
Other comprehensive income (loss), net of income tax: ...........................
.
Unrealized gains on securities, net of income tax of $520,302 ..........
.
— — — — — 995,715 (1) — 995,715
Defined benefit pension plans, net of income taxes of $7,307 ...........
.
— — — — — 13,289 — 13,289
Foreign currency translation adjustments ...........................................
.
— — — — — 201,252 — 201,252
Unrealized gains in cash flow hedging instruments, net of income
taxes of $60,904 ............................................................................
.
— — — — — 94,194 — 94,194
Other comprehensive income (loss) ..........................................................
.
— — — — — 1,304,450 — 1,304,450
Comprehensive income (loss) ..........................................................................
.
2,188,231
Cash dividends-Common stock $.53 per share ................................................
.
— — — — (213,669) — — (213,669)
Cash dividends-Preferred stock 5% per annum ...............................................
.
— — (22,714) — (82,461) — — (105,175)
Purchase of treasury stock ................................................................................
.
— — — — — — (14,572) (14,572)
Issuances of common stock and restricted stock, net of forfeitures ................
.
61,041,008 610 — 1,535,520 — — — 1,536,130
Exercise of stock options and tax benefits of exercises and restricted stoc
k
vesting ........................................................................................................
.
358,552 4 — (6,885) — — — (6,881)
Accretion of preferred stock discount ..............................................................
.
— — 33,554 — (33,554) — — —
Redemption of preferred stock .........................................................................
.
— — (3,107,306) — (447,893) — — (3,555,199)
Compensation expense for restricted stock awards and stock options ............
.
— — — 116,023 — — — 116,023
Issuance of common stock for acquisition .......................................................
.
2,560,601 26 — 30,830 — — — 30,856
Allocation of ESOP shares ...............................................................................
.
— — — 1,233 — — — 1,233
Balance, December 31, 2009 502,394,396 $ 5,024 $ — $ 18,954,823 $ 10,727,368 $ 82,654 $ (3,180,459) $ 26,589,410
(1) Unrealized losses not related to credit on other-than-temporarily impaired securities of $116.8 million (net of income tax of $64.5 million) was reported in other
comprehensive income as of December 31, 2009. The credit-related impairment of $31.6 million on these securities is recorded in the Consolidated Statements of Income
for the year ended December 31, 2009.
See Notes to Consolidated Financial Statements.


