Capital One 2009 Annual Report Download - page 104
Download and view the complete annual report
Please find page 104 of the 2009 Capital One annual report below. You can navigate through the pages in the report by either clicking on the pages listed below, or by using the keyword search tool below to find specific information within the annual report.-
 1
1 -
2
-
3
-
4
-
5
-
6
-
7
-
8
-
9
-
10
-
11
-
12
-
13
-
14
-
15
-
16
-
17
-
18
-
19
-
20
-
21
-
22
-
23
-
24
-
25
-
26
-
27
-
28
-
29
-
30
-
31
-
32
-
33
-
34
-
35
-
36
-
37
-
38
-
39
-
40
-
41
-
42
-
43
-
44
-
45
-
46
-
47
-
48
-
49
-
50
-
51
-
52
-
53
-
54
-
55
-
56
-
57
-
58
-
59
-
60
-
61
-
62
-
63
-
64
-
65
-
66
-
67
-
68
-
69
-
70
-
71
-
72
-
73
-
74
-
75
-
76
-
77
-
78
-
79
-
80
-
81
-
82
-
83
-
84
-
85
-
86
-
87
-
88
-
89
-
90
-
91
-
92
-
93
-
 94
94 -
 95
95 -
 96
96 -
 97
97 -
 98
98 -
 99
99 -
 100
100 -
 101
101 -
 102
102 -
 103
103 -
 104
104 -
 105
105 -
 106
106 -
 107
107 -
 108
108 -
 109
109 -
 110
110 -
 111
111 -
 112
112 -
 113
113 -
 114
114 -
115
-
116
-
117
-
118
-
119
-
120
-
121
-
122
-
123
-
124
-
125
-
126
-
127
-
128
-
129
-
130
-
131
-
132
-
133
-
134
-
135
-
136
-
137
-
138
-
139
-
140
-
141
-
142
-
143
-
144
-
145
-
146
-
147
-
148
-
149
-
150
-
151
-
152
-
153
-
154
-
155
-
156
-
157
-
158
-
159
-
160
-
161
-
162
-
163
-
164
-
165
-
166
-
167
-
168
-
169
-
170
-
171
-
172
-
173
-
174
-
175
-
176
-
177
-
178
-
179
-
180
-
181
-
182
-
183
-
184
-
185
-
186
-
187
-
188
-
189
-
190
-
191
-
192
-
193
-
194
-
195
-
196
-
197
-
198
-
199
-
200
-
201
-
202
-
203
-
204
-
205
-
206
-
207
-
208
-
209
 |
 |

91
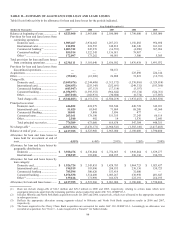
TABLE D—COMPOSITION OF REPORTED LOAN PORTFOLIO
As of December 31
2009(2)
2008 2007 2006
2005
(Dollars in thousands)
Loans
% of
Total
Loans
Loans
% of
Total
Loans Loans
% of
Total
Loans Loans
% of
Total
Loans
Loans
% of
Total
Loans
Reported:
Consumer loans .................. $ 60,554,252 66.82% $ 70,942,802 70.23% $ 74,171,997 72.85% $ 60,621,131 62.81% $ 43,530,976 72.74 %
Commercial loans ............... 29,613,050 32.68% 29,541,314 29.24% 27,047,241 26.57% 4,415,704 4.58% — —
Other
(1)
............................... 451,697 0.50% 533,655 0.53% 585,789 0.58% 31,475,304 32.61% 16,316,705 27.26 %
Total ....................... $ 90,618,999 100.00% $ 101,017,771 100.00% $ 101,805,027 100.00% $ 96,512,139 100.00% $ 59,847,681 100.00 %
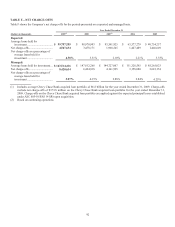
(1) Includes Hibernia Bank acquisition in 2005 and North Fork Bank acquisition in 2006, which were allocated to the appropriate loan categories in the subsequent years.
(2) Includes the loans from the acquisition of Chevy Chase Bank on February 27, 2009.
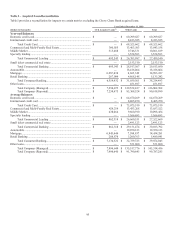
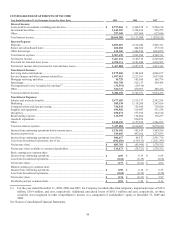
TABLE E—DELINQUENCIES
Table E shows the Company’s loan delinquency trends for the periods presented on a reported and managed basis.
As of December 31
2009(4)
2008 2007 2006
2005
(Dollars in thousands)
Loans
% of
Total
Loans
Loans
% of
Total
Loans Loans
% of
Total
Loans Loans
% of
Total
Loans
Loans
% of
Total
Loans
Reported(1) (3) :
Loans held for investment ......
.
$ 90,618,999 100.00% $ 101,017,771 100.00% $ 101,805,027 100.00% $ 96,512,139 100.00% $ 59,847,681 100.00%
Loans delinquent:
30-59 days .................
.
1,907,677 2.10% 2,325,190 2.30% 2,052,086 2.02% 1,512,365 1.57% 1,055,027 1.76%
60-89 days .................
.
985,211 1.09% 1,094,076 1.08% 869,452 0.86% 563,012 0.58% 401,640 0.67%
90-119 days ...............
.
498,631 0.55% 574,743 0.57% 450,268 0.44% 291,759 0.30% 230,780 0.39%
120-149 days .............
.
190,356 0.21% 229,436 0.23% 194,892 0.19% 167,260 0.17% 104,817 0.18%
150 or more days .......
.
164,389 0.18% 194,378 0.19% 154,746 0.15% 114,007 0.12% 86,744 0.14%
Total ..............
.
$ 3,746,264 4.13% $ 4,417,823 4.37% $ 3,721,444 3.66% $ 2,648,403 2.74% $ 1,879,008 3.14%
Loans delinquent by geographic area:
Domestic ....................
.
3,602,879 4.08% 4,271,511 4.36% 3,592,845 3.67% 2,543,050 2.74% 1,789,926 3.20%
International ...............
.
143,385 6.28% 146,312 4.89% 128,599 3.20% 105,353 2.74% 89,082 2.28%
Managed(2)(3) :
Loans held for investment ......
.
$136,802,902 100.00% $ 146,936,754 100.00% $ 151,362,417 100.00% $ 146,151,268 100.00% $ 105,527,491 100.00%
Loans delinquent:
30-59 days .................
.
2,623,499 1.92% 2,987,184 2.03% 2,737,547 1.81% 2,129,884 1.46% 1,620,075 1.54%
60-89 days .................
.
1,575,753 1.15% 1,581,659 1.08% 1,343,539 0.89% 945,844 0.65% 740,917 0.70%
90-119 days ...............
.
1,037,576 0.76% 981,981 0.67% 840,776 0.55% 602,472 0.41% 498,927 0.47%
120-149 days .............
.
659,961 0.48% 569,528 0.39% 512,789 0.34% 412,386 0.28% 309,587 0.29%
150 or more days .......
.
568,369 0.42% 475,871 0.32% 429,146 0.28% 323,459 0.22% 254,314 0.24%
Total ..............
.
$ 6,465,158 4.73% $ 6,596,223 4.49% $ 5,863,797 3.87% $ 4,414,045 3.02% $ 3,423,820 3.24%
Loans delinquent by geographic area:
Domestic ....................
.
5,887,872 4.58% 6,080,324 4.40% 5,271,552 3.77% 4,271,511 3.18% 2,900,938 3.06 %
International ...............
.
577,286 6.98% 515,899 5.92% 592,245 5.08% 589,416 5.02% 522,882 4.91 %
(1) All loans are accruing loans except for consumer auto loans included in the 90-119 days past bucket of $143.3 million in 2009, $164.6 million in 2008, $159.8 million in
2007, $82.1 million in 2006 and $61.0 million in 2005.
(2) All loans are accruing loans except for consumer auto loans included in the 90-119 days past bucket of $143.3 million in 2009, $164.6 million in 2008, $160.9 million in
2007, $85.6 million in 2006 and $67.5 million in 2005.
(3) Includes credit card loans that continue to accrue finance charges and fees until charged off. The amounts are net of finance charges and fees considered uncollectible that
are suppressed and are not recognized in income. Amounts reserved for finance charges and fees considered uncollectible are $2.1 billion in 2009, $1.9 billion in 2008,
$1.1 billion in 2007, $0.9 billion in 2006 and $1.0 billion in 2005.
(4) The Chevy Chase Bank acquired loan portfolio is included in loans held for investment, but excluded from loans delinquent as these loans are considered performing under
ASC 805-10/SFAS 141 (R) and/or ASC310-10/SOP 03-3. As of December 31, 2009 the acquired loan portfolio’s contractual 30 to 89 day delinquencies total $294.4
million. For loans 90+ days past due see Table G – Nonperforming Assets.