Capital One 2009 Annual Report Download - page 67
Download and view the complete annual report
Please find page 67 of the 2009 Capital One annual report below. You can navigate through the pages in the report by either clicking on the pages listed below, or by using the keyword search tool below to find specific information within the annual report.-
 1
1 -
2
-
3
-
4
-
5
-
6
-
7
-
8
-
9
-
10
-
11
-
12
-
13
-
14
-
15
-
16
-
17
-
18
-
19
-
20
-
21
-
22
-
23
-
24
-
25
-
26
-
27
-
28
-
29
-
30
-
31
-
32
-
33
-
34
-
35
-
36
-
37
-
38
-
39
-
40
-
41
-
42
-
43
-
44
-
45
-
46
-
47
-
48
-
49
-
50
-
51
-
52
-
53
-
54
-
55
-
56
-
 57
57 -
 58
58 -
 59
59 -
 60
60 -
 61
61 -
 62
62 -
 63
63 -
 64
64 -
 65
65 -
 66
66 -
 67
67 -
 68
68 -
 69
69 -
 70
70 -
 71
71 -
 72
72 -
 73
73 -
 74
74 -
 75
75 -
 76
76 -
 77
77 -
78
-
79
-
80
-
81
-
82
-
83
-
84
-
85
-
86
-
87
-
88
-
89
-
90
-
91
-
92
-
93
-
94
-
95
-
96
-
97
-
98
-
99
-
100
-
101
-
102
-
103
-
104
-
105
-
106
-
107
-
108
-
109
-
110
-
111
-
112
-
113
-
114
-
115
-
116
-
117
-
118
-
119
-
120
-
121
-
122
-
123
-
124
-
125
-
126
-
127
-
128
-
129
-
130
-
131
-
132
-
133
-
134
-
135
-
136
-
137
-
138
-
139
-
140
-
141
-
142
-
143
-
144
-
145
-
146
-
147
-
148
-
149
-
150
-
151
-
152
-
153
-
154
-
155
-
156
-
157
-
158
-
159
-
160
-
161
-
162
-
163
-
164
-
165
-
166
-
167
-
168
-
169
-
170
-
171
-
172
-
173
-
174
-
175
-
176
-
177
-
178
-
179
-
180
-
181
-
182
-
183
-
184
-
185
-
186
-
187
-
188
-
189
-
190
-
191
-
192
-
193
-
194
-
195
-
196
-
197
-
198
-
199
-
200
-
201
-
202
-
203
-
204
-
205
-
206
-
207
-
208
-
209
 |
 |

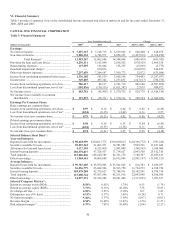
54
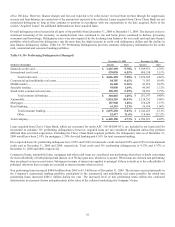
Provision for loan and lease losses
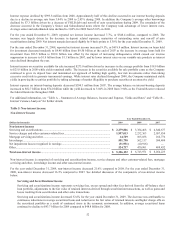
Provision for loan and lease losses decreased $870.9 million, or 17.1% for the year ended December 31, 2009. The decrease was due
an allowance release of $396.6 million in 2009 compared to an allowance build of $1.6 billion in 2008 offset by an increase in charge
offs of $1.1 billion. The reduction in allowance was driven by a smaller reported book and actual credit performance that has been
better than expected partially offset by an increase in the charge-off rate of 107 basis points to 4.58% during 2009. The increase in
reported charge offs is a result of continued deterioration of the economy the Company operates.
For the year ended December 31, 2008, provision for loan and lease losses increased $2.5 billion, or 93%. The increase in the
provision is a result of continued worsening of the economy which rapidly deteriorated during the later part of 2008 as evidenced by
increases in both the charge-off rate and delinquency rate, rising to 3.51% and 4.37%, respectively, from 2.10% and 3.66%,
respectively. The provision for loan and lease loses increased $1.0 billion in the fourth quarter alone as the Company increased the
allowance for loan and lease losses as the unemployment rate and housing prices showed significant worsening during the fourth
quarter of 2008.
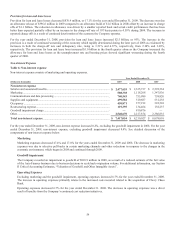
Non-Interest Expense
Table 6: Non-interest expense
Non-interest expense consists of marketing and operating expenses.
Year Ended December 31,
(Dollars in thousands)
2009 2008
2007
Non-interest expense
Salaries and associated benefits ......................................................................................
.
$ 2,477,655 $ 2,335,737 $ 2,592,534
Marketing .......................................................................................................................
.
588,338 1,118,208 1,347,836
Communications and data processing ............................................................................
.
740,543 755,989 758,820
Supplies and equipment ..................................................................................................
.
499,582 519,687 531,238
Occupancy ......................................................................................................................
.
450,871 377,192 322,510
Restructuring expense .....................................................................................................
.
119,395 134,464 138,237
Goodwill impairment charge ..........................................................................................
.
— 810,876 —
Other ...............................................................................................................................
.
2,540,670 2,157,874 2,386,835
Total non-interest expense ...........................................................................................
.
$ 7,417,054 $ 8,210,027 $ 8,078,010
For the year ended December 31, 2009, non-interest expense increased 0.2%, excluding the goodwill impairment in 2008. For the year
ended December 31, 2008, non-interest expense, excluding goodwill impairment decreased 8.4%. See detailed discussion of the
components of non-interest expense below.
Marketing
Marketing expenses decreased 47.4% and 17.0% for the years ended December 31, 2009 and 2008. The decrease in marketing
expenses was due to selective pull-backs in certain marketing channels and other reductions in response to the changes in the
economic environment, which began in 2008 and continued through 2009.
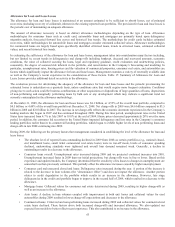
Goodwill impairment
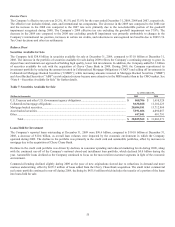
The Company recorded an impairment to goodwill of $810.9 million in 2008, as a result of a reduced estimate of the fair value
of the Auto Finance business due to business decisions to scale back origination volume. For additional information, see Section
II Critical Accounting Estimates, “Valuation of Goodwill and Other Intangible Assets”.
Operating Expenses
Excluding marketing and the goodwill impairment, operating expenses increased 8.7% for the year ended December 31, 2009.
The increase in operating expenses primarily relates to the increased costs incurred related to the acquisition of Chevy Chase
Bank.
Operating expenses decreased 6.7% for the year ended December 31. 2008. The decrease in operating expenses was a direct
result of benefits from the Company’s continued cost reduction initiatives.