Capital One 2009 Annual Report Download - page 111
Download and view the complete annual report
Please find page 111 of the 2009 Capital One annual report below. You can navigate through the pages in the report by either clicking on the pages listed below, or by using the keyword search tool below to find specific information within the annual report.-
 1
1 -
2
-
3
-
4
-
5
-
6
-
7
-
8
-
9
-
10
-
11
-
12
-
13
-
14
-
15
-
16
-
17
-
18
-
19
-
20
-
21
-
22
-
23
-
24
-
25
-
26
-
27
-
28
-
29
-
30
-
31
-
32
-
33
-
34
-
35
-
36
-
37
-
38
-
39
-
40
-
41
-
42
-
43
-
44
-
45
-
46
-
47
-
48
-
49
-
50
-
51
-
52
-
53
-
54
-
55
-
56
-
57
-
58
-
59
-
60
-
61
-
62
-
63
-
64
-
65
-
66
-
67
-
68
-
69
-
70
-
71
-
72
-
73
-
74
-
75
-
76
-
77
-
78
-
79
-
80
-
81
-
82
-
83
-
84
-
85
-
86
-
87
-
88
-
89
-
90
-
91
-
92
-
93
-
94
-
95
-
96
-
97
-
98
-
99
-
100
-
 101
101 -
 102
102 -
 103
103 -
 104
104 -
 105
105 -
 106
106 -
 107
107 -
 108
108 -
 109
109 -
 110
110 -
 111
111 -
 112
112 -
 113
113 -
 114
114 -
 115
115 -
 116
116 -
 117
117 -
 118
118 -
 119
119 -
 120
120 -
 121
121 -
122
-
123
-
124
-
125
-
126
-
127
-
128
-
129
-
130
-
131
-
132
-
133
-
134
-
135
-
136
-
137
-
138
-
139
-
140
-
141
-
142
-
143
-
144
-
145
-
146
-
147
-
148
-
149
-
150
-
151
-
152
-
153
-
154
-
155
-
156
-
157
-
158
-
159
-
160
-
161
-
162
-
163
-
164
-
165
-
166
-
167
-
168
-
169
-
170
-
171
-
172
-
173
-
174
-
175
-
176
-
177
-
178
-
179
-
180
-
181
-
182
-
183
-
184
-
185
-
186
-
187
-
188
-
189
-
190
-
191
-
192
-
193
-
194
-
195
-
196
-
197
-
198
-
199
-
200
-
201
-
202
-
203
-
204
-
205
-
206
-
207
-
208
-
209
 |
 |

98
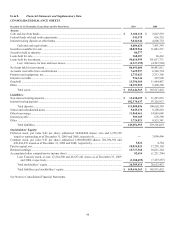
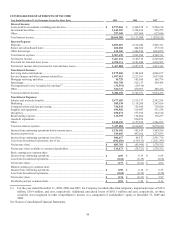
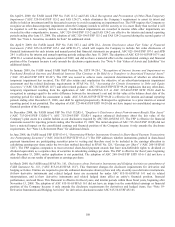
Item 8. Financial Statements and Supplementary Data
CONSOLIDATED BALANCE SHEETS
December 31 (In Thousands, Except Share and Per Share Data)
2009
2008
Assets:
Cash and due from banks .................................................................................................................
.
$ 3,100,110 $ 2,047,839
Federal funds sold and resale agreements ........................................................................................
.
541,570 636,752
Interest bearing deposits at other banks ...........................................................................................
.
5,042,944 4,806,752
Cash and cash equivalents ......................................................................................................
.
8,684,624 7,491,343
Securities available for sale .............................................................................................................
.
38,829,562 31,003,271
Securities held to maturity ...............................................................................................................
.
80,577 —
Loans held for sale ...........................................................................................................................
.
268,307 68,462
Loans held for investment ................................................................................................................
.
90,618,999 101,017,771
Less: Allowance for loan and lease losses ..............................................................................
.
(4,127,395) (4,523,960)
N
et loans held for investment ..........................................................................................................
.
86,491,604 96,493,811
Accounts receivable from securitizations ........................................................................................
.
7,629,597 6,342,754
Premises and equipment, net ............................................................................................................
.
2,735,623 2,313,106
Interest receivable ............................................................................................................................
.
936,146 827,909
Goodwill ..........................................................................................................................................
.
13,596,368 11,964,487
Other ................................................................................................................................................
.
10,393,955 9,408,309
Total assets .............................................................................................................................
.
$ 169,646,363 $ 165,913,452
Liabilities:
N
on-interest bearing deposits...........................................................................................................
.
$ 13,438,659 $ 11,293,852
Interest bearing deposits ..................................................................................................................
.
102,370,437 97,326,937
Total deposits .........................................................................................................................
.
115,809,096 108,620,789
Senior and subordinated notes .........................................................................................................
.
9,045,470 8,308,843
Other borrowings .............................................................................................................................
.
11,968,461 14,869,648
Interest payable ................................................................................................................................
.
509,105 676,398
Other ................................................................................................................................................
.
5,724,821 6,825,341
Total liabilities ........................................................................................................................
.
143,056,953 139,301,019
Stockholders’ Equity:
Preferred stock, par value $.01 per share; authorized 50,000,000 shares; zero and 3,555,199
issued or outstanding as of December 31, 2009 and 2008, respectively .....................................
.
— 3,096,466
Common stock, par value $.01 per share; authorized 1,000,000,000 shares; 502,394,396 and
438,434,235 issued as of December 31, 2009 and 2008, respectively ........................................
.
5,024 4,384
Paid-in capital, net ...........................................................................................................................
.
18,954,823 17,278,102
Retained earnings .............................................................................................................................
.
10,727,368 10,621,164
Accumulated other comprehensive income (loss) ...........................................................................
.
82,654 (1,221,796)
Less: Treasury stock, at cost; 47,224,200 and 46,637,241 shares as of December 31, 2009
and 2008, respectively .......................................................................................................
.
(3,180,459) (3,165,887)
Total stockholders’ equity ......................................................................................................
.
26,589,410 26,612,433
Total liabilities and stockholders’ equity ................................................................................
.
$ 169,646,363 $ 165,913,452
See Notes to Consolidated Financial Statements.