Capital One 2009 Annual Report Download - page 66
Download and view the complete annual report
Please find page 66 of the 2009 Capital One annual report below. You can navigate through the pages in the report by either clicking on the pages listed below, or by using the keyword search tool below to find specific information within the annual report.-
 1
1 -
2
-
3
-
4
-
5
-
6
-
7
-
8
-
9
-
10
-
11
-
12
-
13
-
14
-
15
-
16
-
17
-
18
-
19
-
20
-
21
-
22
-
23
-
24
-
25
-
26
-
27
-
28
-
29
-
30
-
31
-
32
-
33
-
34
-
35
-
36
-
37
-
38
-
39
-
40
-
41
-
42
-
43
-
44
-
45
-
46
-
47
-
48
-
49
-
50
-
51
-
52
-
53
-
54
-
55
-
 56
56 -
 57
57 -
 58
58 -
 59
59 -
 60
60 -
 61
61 -
 62
62 -
 63
63 -
 64
64 -
 65
65 -
 66
66 -
 67
67 -
 68
68 -
 69
69 -
 70
70 -
 71
71 -
 72
72 -
 73
73 -
 74
74 -
 75
75 -
 76
76 -
77
-
78
-
79
-
80
-
81
-
82
-
83
-
84
-
85
-
86
-
87
-
88
-
89
-
90
-
91
-
92
-
93
-
94
-
95
-
96
-
97
-
98
-
99
-
100
-
101
-
102
-
103
-
104
-
105
-
106
-
107
-
108
-
109
-
110
-
111
-
112
-
113
-
114
-
115
-
116
-
117
-
118
-
119
-
120
-
121
-
122
-
123
-
124
-
125
-
126
-
127
-
128
-
129
-
130
-
131
-
132
-
133
-
134
-
135
-
136
-
137
-
138
-
139
-
140
-
141
-
142
-
143
-
144
-
145
-
146
-
147
-
148
-
149
-
150
-
151
-
152
-
153
-
154
-
155
-
156
-
157
-
158
-
159
-
160
-
161
-
162
-
163
-
164
-
165
-
166
-
167
-
168
-
169
-
170
-
171
-
172
-
173
-
174
-
175
-
176
-
177
-
178
-
179
-
180
-
181
-
182
-
183
-
184
-
185
-
186
-
187
-
188
-
189
-
190
-
191
-
192
-
193
-
194
-
195
-
196
-
197
-
198
-
199
-
200
-
201
-
202
-
203
-
204
-
205
-
206
-
207
-
208
-
209
 |
 |
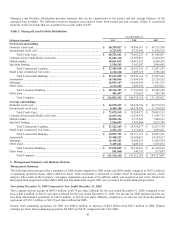
53
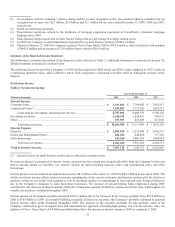
Servicing and securitizations income decreased 30.1% for the year ended December 31, 2008. The decrease was attributable to
reductions in average securitized loans year over year and to reductions in fair value of retained interests due to the worsening
global credit environment. Average securitized loans were $48.8 billion for 2008 compared to $51.2 billion in 2007.
Beginning January 1, 2010, the Company will be required to consolidate certain loans previously transferred to VIE’s and
accounted for as sales. The loans will be included as loans held for investment and the corresponding income from these
securitized loans will no longer be reflected as securitization income. Interest income, net charge-offs and certain other income
associated with securitized loan receivables and interest expense associated with the debt securities issued from the trusts to
third party investors will be reporting in the same line as non-securitized loan receivables and corporate debt. Additionally, we
will no longer record gains on new securitization activity or valuation adjustments on retained interests including the interest-
only strip, retained senior and subordinate tranches and restricted cash collateral accounts unless the Company achieves sale
accounting under ASU 2009-16 (ASC 860/SFAS 166) and achieves deconsolidation under ASU 2009-17 (ASC 810/SFAS 167).
See “Item III. Off-Balance Sheet Arrangements” and “Note 1 – Significant Accounting Policies” for the pro forma impacts on
our consolidated financial statements.
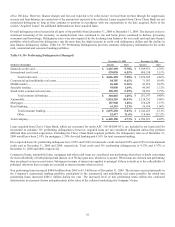
Service Charges and Other Customer-Related Fees
For 2009, service charges and other customer-related fees declined by 10.5% primarily due to a reduction in collectable
overlimit and cash advance fees.
For 2008, service charges and other customer-related fees grew 8.5% due to higher overlimit and cash advance fees.
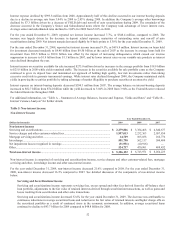
Mortgage Servicing and Other Income
Mortgage servicing and other income is comprised of non-interest income related to our mortgage servicing business and other
mortgage related income. For the year ended December 31, 2009, mortgage servicing and other income decreased 86.0% from
the prior year due to the changes in fair value of the mortgage servicing rights attributable to the run-off of the portfolio,
recognition of impairment, and reduced gains on sales due to lower originations in 2009. The Company has been notified by the
insurer of certain Chevy Chase Bank mortgage securitization transactions that it will be removed as servicer of mortgage loans
with an aggregate unpaid principal balance of $3.1 billion as of December 31, 2009. The fair value of mortgage servicing rights
at December 31, 2009 reflects this expected loss of servicing, which is included in the table above. See “Note 15 – Mortgage
Servicing Rights” for further details.
For the year ended December 31, 2008, mortgage servicing and other income decreased 37.0% from prior year due to the
changes in fair value of the mortgage servicing rights attributable to the run-off of the portfolio and reduced gains on sales due
to lower originations in 2008.
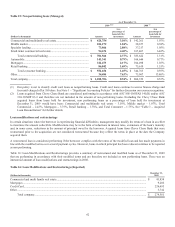
Interchange
Interchange income, net of rewards expense, decreased 10.7% for the year ended December 31, 2009 on a reported basis due to
a decrease in purchase volume of 8.6% as compared to 2008. Interchange on a managed basis decreased 3.9% due to decreases
in managed purchase volume of 10.3% offset by decreases in rewards expense. Costs associated with the Company’s rewards
programs in 2009 were $191.7 million on a reported basis and $582.6 million on a managed basis.
Interchange income, net of rewards expense, increased 12.3% for the year ended December 31, 2008 on a reported basis due to a
shift in loans from our off-balance sheet securitized loans to our reported on-balance sheet loans during 2008. Interchange on a
managed basis decreased 7.8% due to decreases in managed purchase volume of 1.2% and increases in rewards expense. Costs
associated with the Company’s rewards programs in 2008 were $221.4 million on a reported basis and $709.2 million on a
managed basis. The increase in the rewards expense was due to an expansion of our rewards programs.
Other Non-Interest Income
Other non-interest income includes, among other items, gains and losses on sales of securities and gains and losses associated
with hedging transactions.
Other non-interest income for the year ended December 31, 2009 increased $53.8 million or 11.4%. The increase was related to
additional income generated by sales of securities during 2009 and the effects of a hedge program on brokered CDs offset by
decreases in the fair value of the Company’s free standing derivatives.
Other non-interest income for the year ended December 31, 2008 decreased $28.4 million or 5.8%. The decrease was primarily
due to reduced commission income and changes in exchange rates from 2007. Other non-interest income for 2008 also includes
a $109.0 million gain from the redemption of shares related to the Visa IPO and a gain of $44.9 million from the sale of
MasterCard stock.