Capital One 2009 Annual Report Download - page 68
Download and view the complete annual report
Please find page 68 of the 2009 Capital One annual report below. You can navigate through the pages in the report by either clicking on the pages listed below, or by using the keyword search tool below to find specific information within the annual report.-
 1
1 -
2
-
3
-
4
-
5
-
6
-
7
-
8
-
9
-
10
-
11
-
12
-
13
-
14
-
15
-
16
-
17
-
18
-
19
-
20
-
21
-
22
-
23
-
24
-
25
-
26
-
27
-
28
-
29
-
30
-
31
-
32
-
33
-
34
-
35
-
36
-
37
-
38
-
39
-
40
-
41
-
42
-
43
-
44
-
45
-
46
-
47
-
48
-
49
-
50
-
51
-
52
-
53
-
54
-
55
-
56
-
57
-
 58
58 -
 59
59 -
 60
60 -
 61
61 -
 62
62 -
 63
63 -
 64
64 -
 65
65 -
 66
66 -
 67
67 -
 68
68 -
 69
69 -
 70
70 -
 71
71 -
 72
72 -
 73
73 -
 74
74 -
 75
75 -
 76
76 -
 77
77 -
 78
78 -
79
-
80
-
81
-
82
-
83
-
84
-
85
-
86
-
87
-
88
-
89
-
90
-
91
-
92
-
93
-
94
-
95
-
96
-
97
-
98
-
99
-
100
-
101
-
102
-
103
-
104
-
105
-
106
-
107
-
108
-
109
-
110
-
111
-
112
-
113
-
114
-
115
-
116
-
117
-
118
-
119
-
120
-
121
-
122
-
123
-
124
-
125
-
126
-
127
-
128
-
129
-
130
-
131
-
132
-
133
-
134
-
135
-
136
-
137
-
138
-
139
-
140
-
141
-
142
-
143
-
144
-
145
-
146
-
147
-
148
-
149
-
150
-
151
-
152
-
153
-
154
-
155
-
156
-
157
-
158
-
159
-
160
-
161
-
162
-
163
-
164
-
165
-
166
-
167
-
168
-
169
-
170
-
171
-
172
-
173
-
174
-
175
-
176
-
177
-
178
-
179
-
180
-
181
-
182
-
183
-
184
-
185
-
186
-
187
-
188
-
189
-
190
-
191
-
192
-
193
-
194
-
195
-
196
-
197
-
198
-
199
-
200
-
201
-
202
-
203
-
204
-
205
-
206
-
207
-
208
-
209
 |
 |

55
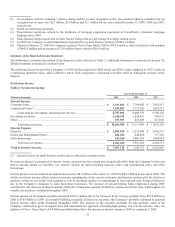
Income Taxes
The Company’s effective tax rate was 26.2%, 85.5% and 33.0% for the years ended December 31, 2009, 2008 and 2007, respectively.
The effective rate includes federal, state, and international tax components. The decrease in the 2009 rate compared to the 2008 rate
and the increase in the 2008 rate compared to the 2007 rate were primarily due to the non-deductible portion of the goodwill
impairment recognized during 2008. The Company’s 2008 effective tax rate excluding the goodwill impairment was 37.8%. The
decrease in the 2009 rate compared to the 2008 rate excluding goodwill impairment was primarily attributable to changes in the
Company’s international tax position, increases in certain tax credits, and reductions in unrecognized tax benefits due to 2009 U.S.
Tax Court decisions and other tax settlements.
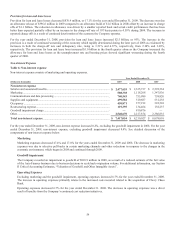
Balance Sheet
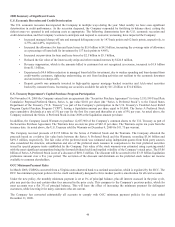
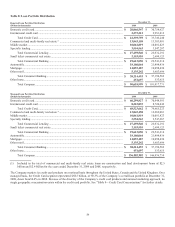
Securities Available for Sale
The Company held $38.8 billion in securities available for sale at December 31, 2009, compared to $31.0 billion at December 31,
2008. The increase in the portfolio of securities available for sale during 2009 reflects the Company’s continuing strategy to grow its
deposit base and maintain our approach of holding high quality, lower risk investments. In addition, the Company added $1.3 billion
of securities available for sale with the acquisition of Chevy Chase Bank in 2009. During 2009, the Company repositioned its
investment portfolio by reducing the amount invested in Collateralized Mortgage Obligations (“CMO”) and selling off investments in
Collateralized Mortgage Backed Securities (“CMBS”); while increasing amounts invested in Mortgage Backed Securities (“MBS”)
and Asset Backed Securities (“ABS”) as risk adjusted returns became more attractive in the MBS market than in the CMO market. See
“Note 6 – Securities Available for Sale” for further details.
Table 7: Securities Available for Sale
As of December 31,
(Dollars in thousands)
2009
2008
U.S. Treasury and other U.S. Government agency obligations ............................................................
.
$ 868,706 $ 1,610,329
Collateralized mortgage obligations .....................................................................................................
.
9,638,028 11,102,225
Mortgage backed securities ...................................................................................................................
.
20,684,181 13,712,869
Asset backed securities .........................................................................................................................
.
7,191,606 4,096,057
Other .....................................................................................................................................................
.
447,041 481,791
Total ............................................................................................................................................
.
$ 38,829,562 $ 31,003,271
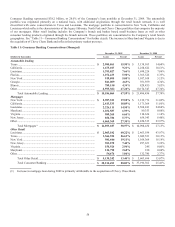
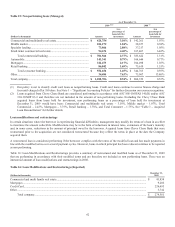
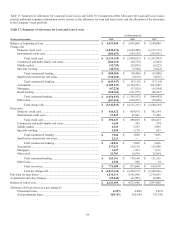
Loans Held for Investment
The Company’s reported loans outstanding at December 31, 2009 were $90.6 billion, compared to $101.0 billion at December 31,
2008, a decrease of $10.4 billion, as overall loan volumes were impacted by the economic environment in which the Company
operated during 2009. The decline in the portfolio was primarily in the credit card and automobile portfolios, offset by increases in
mortgage due to the acquisition of Chevy Chase Bank.
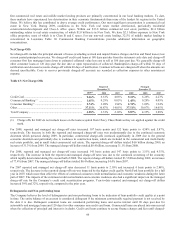
Declines in the credit card portfolio was driven by declines in consumer spending and reduced marketing levels during 2009, along
with the continued run-off of the Company’s national closed-end installment loan portfolio, which declined $4.0 billion during the
year. Automobile loans declined as the Company continued to focus on the most resilient customer segments in light of the economic
environment.
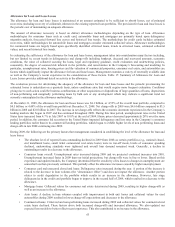
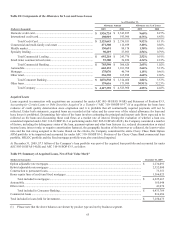
Commercial lending declined slightly during 2009 as the pace of new originations slowed due to reductions in demand and more
cautious underwriting, offset by $695.5 million of loans added from the Chevy Chase Bank acquisition. The small ticket commercial
real estate portfolio continued to run-off during 2009, declining by $455.6 million which includes the transfer of a portion of the loans
into loans held for sale.