Capital One 2009 Annual Report Download - page 75
Download and view the complete annual report
Please find page 75 of the 2009 Capital One annual report below. You can navigate through the pages in the report by either clicking on the pages listed below, or by using the keyword search tool below to find specific information within the annual report.-
 1
1 -
2
-
3
-
4
-
5
-
6
-
7
-
8
-
9
-
10
-
11
-
12
-
13
-
14
-
15
-
16
-
17
-
18
-
19
-
20
-
21
-
22
-
23
-
24
-
25
-
26
-
27
-
28
-
29
-
30
-
31
-
32
-
33
-
34
-
35
-
36
-
37
-
38
-
39
-
40
-
41
-
42
-
43
-
44
-
45
-
46
-
47
-
48
-
49
-
50
-
51
-
52
-
53
-
54
-
55
-
56
-
57
-
58
-
59
-
60
-
61
-
62
-
63
-
64
-
 65
65 -
 66
66 -
 67
67 -
 68
68 -
 69
69 -
 70
70 -
 71
71 -
 72
72 -
 73
73 -
 74
74 -
 75
75 -
 76
76 -
 77
77 -
 78
78 -
 79
79 -
 80
80 -
 81
81 -
 82
82 -
 83
83 -
 84
84 -
 85
85 -
86
-
87
-
88
-
89
-
90
-
91
-
92
-
93
-
94
-
95
-
96
-
97
-
98
-
99
-
100
-
101
-
102
-
103
-
104
-
105
-
106
-
107
-
108
-
109
-
110
-
111
-
112
-
113
-
114
-
115
-
116
-
117
-
118
-
119
-
120
-
121
-
122
-
123
-
124
-
125
-
126
-
127
-
128
-
129
-
130
-
131
-
132
-
133
-
134
-
135
-
136
-
137
-
138
-
139
-
140
-
141
-
142
-
143
-
144
-
145
-
146
-
147
-
148
-
149
-
150
-
151
-
152
-
153
-
154
-
155
-
156
-
157
-
158
-
159
-
160
-
161
-
162
-
163
-
164
-
165
-
166
-
167
-
168
-
169
-
170
-
171
-
172
-
173
-
174
-
175
-
176
-
177
-
178
-
179
-
180
-
181
-
182
-
183
-
184
-
185
-
186
-
187
-
188
-
189
-
190
-
191
-
192
-
193
-
194
-
195
-
196
-
197
-
198
-
199
-
200
-
201
-
202
-
203
-
204
-
205
-
206
-
207
-
208
-
209
 |
 |

62
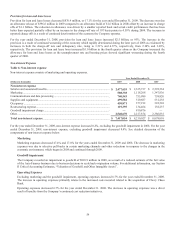
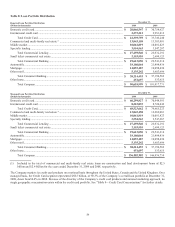
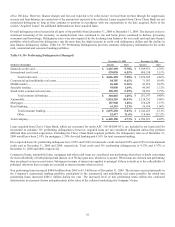
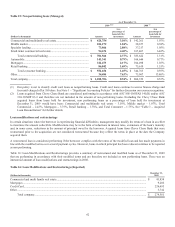
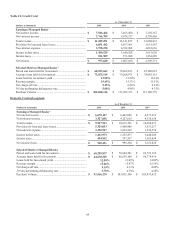
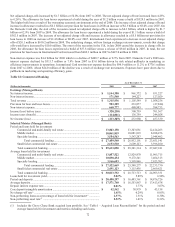
Table 15: Non performing loans (Managed)
As of December 31,
2009 (1)(2) 2008 (1)
(Dollars in thousands)
Amount
As a
percentage of
loans held for
investment Amount
As a
percentage of
loans held for
investment
Commercial and multifamily real estate ............................................. $ 428,754 3.10% $ 142,261 1.07%
Middle market .................................................................................... 104,272 1.04% 38,677 0.38%
Specialty lending ................................................................................ 73,866 2.08% 37,217 1.05%
Small ticket commercial real estate .................................................... 94,674 4.40% 167,467 6.42%
Total commercial banking ........................................................ $ 701,566 2.37% $ 385,622 1.31%
Automobile ......................................................................................... 143,341 0.79% 164,646 0.77%
Mortgages ........................................................................................... 322,473 2.17% 104,498 1.03%
Retail banking .................................................................................... 86,842 1.69% 75,619 1.35%
Total consumer banking ............................................................ $ 552,656 1.45% $ 344,763 0.93%
Other ................................................................................................... 34,484 7.63% 73,967 13.86%
Total company .................................................................................... $ 1,288,706 0.94% $ 804,352 0.55%
(1) Our policy is not to classify credit card loans as nonperforming loans. Credit card loans continue to accrue finance charge and
fees until charged off at 180 days. See Note 1 – “Significant Accounting Policies” for further discussion on revenue recognition.
(2) Loans acquired from Chevy Chase Bank are considered performing in accordance with ASC 805-10/SFAS 141(R) and/or ASC
310-10/SOP 03-3 and therefore are not included in the amount of non performing loans. Excluding the Chevy Chase Bank
acquired loans from loans held for investment, non performing loans as a percentage of loan held for investment at
December 31, 2009 would have been: Commercial and multifamily real estate – 3.18%, Middle market – 1.07%, Total
Commercial – 2.43%, Mortgages – 3.75%, Retail banking – 1.78%, and Total Consumer – 1.75%. See “Table I – Acquired
Loan Reconciliation” for further details.
Loan modifications and restructurings
In certain situations where the borrower is experiencing financial difficulties, management may modify the terms of a loan in an effort
to maximize the amount collectible. Modifications may be in the form of reductions in interest rates, extensions of the loan’s maturity
and, in some cases, reductions in the amount of principal owed by the borrower. Acquired loans from Chevy Chase Bank that were
restructured prior to the acquisition are not considered restructured because they reflect the terms in place at the date the Company
acquired them.
A restructured loan is considered performing if the borrower complies with the terms of the modified loan and has made payments in
line with the modified terms over several payment cycles. However, loans in which principal has been reduced continue to be reported
as non performing.
Table 16: Loan Modifications and Restructurings provides a summary of restructured and modified loans as of December 31, 2009
that are performing in accordance with their modified terms and are therefore not included as non performing loans. There was an
immaterial amount of loan modifications and restructurings in 2008.
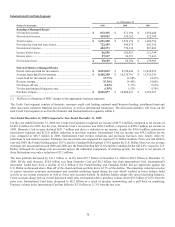
Table 16: Loan Modifications and Restructurings (Reported)
(Dollars in thousands)
December 31,
2009
Commercial and multi family real estate ...........................................................................................................................
.
$ 41,858
Mortgages ..........................................................................................................................................................................
.
9,286
Credit Card .........................................................................................................................................................................
.
224,695
Other ..................................................................................................................................................................................
.
3,742
Total company ..........................................................................................................................................................
.
$ 279,581