Capital One 2009 Annual Report Download - page 148
Download and view the complete annual report
Please find page 148 of the 2009 Capital One annual report below. You can navigate through the pages in the report by either clicking on the pages listed below, or by using the keyword search tool below to find specific information within the annual report.-
 1
1 -
2
-
3
-
4
-
5
-
6
-
7
-
8
-
9
-
10
-
11
-
12
-
13
-
14
-
15
-
16
-
17
-
18
-
19
-
20
-
21
-
22
-
23
-
24
-
25
-
26
-
27
-
28
-
29
-
30
-
31
-
32
-
33
-
34
-
35
-
36
-
37
-
38
-
39
-
40
-
41
-
42
-
43
-
44
-
45
-
46
-
47
-
48
-
49
-
50
-
51
-
52
-
53
-
54
-
55
-
56
-
57
-
58
-
59
-
60
-
61
-
62
-
63
-
64
-
65
-
66
-
67
-
68
-
69
-
70
-
71
-
72
-
73
-
74
-
75
-
76
-
77
-
78
-
79
-
80
-
81
-
82
-
83
-
84
-
85
-
86
-
87
-
88
-
89
-
90
-
91
-
92
-
93
-
94
-
95
-
96
-
97
-
98
-
99
-
100
-
101
-
102
-
103
-
104
-
105
-
106
-
107
-
108
-
109
-
110
-
111
-
112
-
113
-
114
-
115
-
116
-
117
-
118
-
119
-
120
-
121
-
122
-
123
-
124
-
125
-
126
-
127
-
128
-
129
-
130
-
131
-
132
-
133
-
134
-
135
-
136
-
137
-
 138
138 -
 139
139 -
 140
140 -
 141
141 -
 142
142 -
 143
143 -
 144
144 -
 145
145 -
 146
146 -
 147
147 -
 148
148 -
 149
149 -
 150
150 -
 151
151 -
 152
152 -
 153
153 -
 154
154 -
 155
155 -
 156
156 -
 157
157 -
 158
158 -
159
-
160
-
161
-
162
-
163
-
164
-
165
-
166
-
167
-
168
-
169
-
170
-
171
-
172
-
173
-
174
-
175
-
176
-
177
-
178
-
179
-
180
-
181
-
182
-
183
-
184
-
185
-
186
-
187
-
188
-
189
-
190
-
191
-
192
-
193
-
194
-
195
-
196
-
197
-
198
-
199
-
200
-
201
-
202
-
203
-
204
-
205
-
206
-
207
-
208
-
209
 |
 |

135
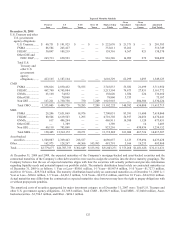
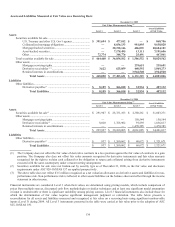
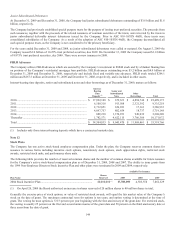
Level 3 Instruments Only
For the Year Ended December 31, 2009
Securities
Available for
Sale
Mortgage
Servicing
Rights(1) Derivative
Receivables(2)
Retained
Interests in
Securitizations(3)
Derivative
Payables(2)
Balance, January 1, 2009 $ 2,380,261 $ 150,544 $ 59,895 $ 1,470,385 $ 60,672
Total realized and unrealized gains
(losses): ...............................................
.
Included in earnings .......................
.
99 (5,505) (213,965) (131,411) (27,574)
Included in other comprehensive
income .......................................
.
(168,380) — — 114,228 —
Purchases, issuances and
settlements, net ...................................
.
(114,008) 94,612 37,870 2,491,338 3,804
Transfers in/(out) of Level 3....................
.
(591,440) — 556,792 — (3,968)
Balance, December 31, 2009 $ 1,506,532 $ 239,651 $ 440,592 $ 3,944,540 $ 32,934
Change in unrealized gains (losses) included in
earnings related to financial instruments
held at December 31, 2009 ...........................
.
$ 99 $ (5,505) $ (213,965) $ 70,749 $ (27,574)
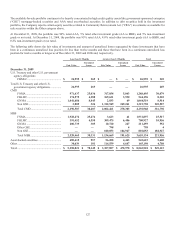
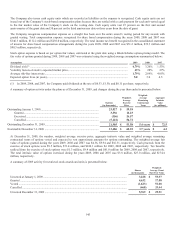
For the Year Ended December 31, 2009
Securities Available for Sale
U.S. Treasury
& other U.S.
Gov’t agency
Collateralized
mortgage
obligations
Mortgage-
backed
securities
Asset-
backed
securities
Other
Total
Balance, January 1, 2009 $ — $ 1,579,909 $ 773,200 $ — $ 27,152 $ 2,380,261
Total realized and unrealized gains
(losses): ........................................
Included in earnings ................ — 213 — (114) — 99
Included in other
comprehensive income ....... — (175,032) 6,652 — — (168,380)
Purchases, issuances and
settlements, net ............................ — (234,768) 48,220 74,201 (1,661) (114,008)
Transfers in/(out) of Level 3............. — (188,427) (342,037) (60,976) — (591,440)
Balance, December 31, 2009 $ — $ 981,895 $ 486,035 $ 13,111 $ 25,491 $ 1,506,532
Change in unrealized gains (losses)
included in earnings related to
financial instruments held at
December 31, 2009 ............................... $ — $ 213 $ — $ (114) $ — $ 99
For the Year ended December 31, 2008
Securities
Available for
Sale
Mortgage
Servicing
Rights(1) Derivative
Receivables(2)
Retained
Interests in
Securitizations(3)
Derivative
Payables(2)
Balance, January 1, 2008 .............................................. $ 217,428 $ 247,589 $ 8,962 $ 1,295,498 $ 8,631
Total realized and unrealized gains (losses): .........
Included in earnings ..................................... 18 (72,516) 33,442 (187,934) 34,072
Included in other comprehensive income .... (696,601) — — (57,259) —
Purchases, issuances and settlements .................... 180,631 (24,529) 17,491 420,080 17,969
Transfers into Level 3 ............................................ 2,678,785 — — — —
Balance, December 31, 2008 ......................................... $ 2,380,261 $ 150,544 $ 59,895 $ 1,470,385 $ 60,672
Change in unrealized gains (losses) included in
earnings related to financial instruments held at
December 31, 2008 .................................................... $ — $ (72,516) $ 33,442 $ (41,055) $ 34,072
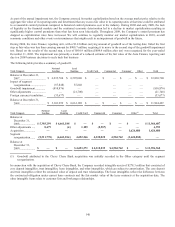
(1) Gains (losses) related to Level 3 mortgage servicing rights are reported in mortgage servicing and other income, which is a
component of non-interest income.
(2) An end of quarter convention is used to measure derivative activity, resulting in end of quarter values being reflected as
purchases, issuances and settlements for derivatives having a zero fair value at inception. Gains (losses) related to Level 3
derivative receivables and derivative payables are reported in other non-interest income, which is a component of non-interest
income.